디지털 항공사진 판독기법을 이용한 산사태 발생 위험지 예측에 관한 연구: 우면산 일대를 대상으로
Study on the Prediction of the Shallow Failure-prone Sites by UsingDigital Aerial Photos: on the Mt. Umyeon in Seoul City
Article information
Abstract
항공사진을 입체시하여 산지붕괴와 관련된 전조현상을 파악하기 위한 노력은 지형학과 방재학 분야에서 폭넓게 시도되어 왔다. 이 연구에서는 최근 독립적으로 이용되는 디지털항공사진, 수치지형도 및 DEM을 소프트도화기 상에서 중첩분석하여 토사재해 전조현상을 파악하고자 하였다. 전조현상 파악의 표준화를 위해 토사재해 관련 미지형을 판독지표로 개발하였고, 소프트도화기 상에서 이를 판독하는 절차와 요령 그리고 최종적으로 판독도를 작성하는 방안을 체계화하고자 하였다. 연구를 통하여 총 23종의 판독지표가 선정되었고, 각 지표의 판독적용을 위한 data 간의 중첩분석 절차를 개발할 수 있었다. 최종적으로 2011년 7월 대형 산사태가 발생한 서울시 우면산을 대상으로 전체 판독지표 중 13종의 판독기호를 개발하였다.
Trans Abstract
Applying stereovision-typed aerial photo for the landslide analysis of mountain is one of the popular method in the parts of geomorphologyand disaster analysis. This study explores the landslide effects by overlapping digital aerial photo, digital terrain map, andDEM on the soft photogrammetry. The standardization for observing the landslide effects is developed, and systematization isexplored by interpreting the procedure and know-how, and finally drawing up of a interpretation map. In this way, total of 23 types ofinterpretation indicator were selected, and able to develop the procedure for overlapping data selected for applying each indicator. Finally, the whole process was applied to the case of Mt. Umyeon in the city of Seoul, and could developed 13 interpretation legends.
1. 연구배경 및 목적
항공사진은 지형분석과 자연재해 관리를 위한 대표적인 기초자료이다. 1911년 독일의 Carl Zeiss사가 개발한 기계식 도화기 기반의 아날로그 사진측량이 지형분야에서 사용된 이래로, 1980년대 도입된 Bundle adjustment의 분석을 통한 해석사진측량 및 디지털사진측량의 시대를 거치면서 초기의 지각운동의 영향을 받은 지형(Tectonic landform) 연구에서부터 지질구조에 지배당하는 지형(Structurally controlled landform)연구에 이르기까지 널리 활용되고 있다(Lin and Oguchi, 2002).
또한 항공사진은 자연재해 분야의 홍수, 해일 및 지진 등과같이 대면적이나 단일 유형의 재해 현황을 파악하는데 중요한 수단으로 활용되고 있다. 특히 재해 전·후의 현황에 대한비교변화를 통해서 피해유무의 판정에 주로 이용되어 왔다(Sugito et al., 2012; Su and Stoher, 2000; Strozii et al.,2013; Shimizu, 1983).
최근 자연재해에 대한 사회적 인식이 방재에서 감재(減災)의 개념으로 전환되면서 재해위험을 사전에 파악하고자 하는 노력이 시도되고 있다. 도시생활권의 도심 내 산지 토사재해 또한 이러한 개념의 방재행정이 요구되어 산지사면의 붕괴전조현상을 수월하게 파악하고자 하는 노력이 시도되고 있다(Kim and Jang, 2014; Kim et al., 2013).
일반적인 항공사진의 판독은 대체로 6개 또는 9개의 판독요소에 의해 이루어지는데, 표면적으로 형상과 특징이 명확한 현상은 이들 판독요소 적용에 의해 고정밀도의 판독결과를 도출할 수 있다(Kim, 1976). 이에 반해 재해발생 전의 산사태관련 전조현상은 특징이 명확하지 않아 주변지형과의 복합적 해석이 요구되지만, 이에 필요한 해석과정은 체계화 되어있지 않은 실정이다.
이러한 배경으로부터 이 연구에서는 디지털 항공사진 측량기법을 이용하여 산지토사재해 방지분야의 미지형분석시 요구되는 판독기법의 정립을 위해 디지털 항공사진의 판독절차, 판독지표 및 판독도 작성의 체계화를 제안하였다.
2. 연구사
이 연구와 관련된 연구사는 크게 지형학 분야와 항공사진측량 분야로 구분할 수 있다. 먼저 지형학 분야에서는 지형공학적 관점에서의 지형계측기법을 이용한 지형분류 연구와 자연재해 예지, 방재를 위한 지형지표의 개발 및 활용에 관한 연구가 진행되었다. 지형분류에 관한 사례를 보면 Demek and Embleton(1978)의 답사, 항공사진, 위성영상 등에서 파악되는 지형요소를 비교 연구하였다. 또한 국내에서는 Kim and Lee(2004)가 수치표고모델(DEM)을 활용하여 지형을 분류하는 연구를 진행하였다. 다음으로 지형지표의 개발 및 활용에 관한 연구의 사례를 보면 Suzuki(1997)가 변동지형 및 침식지형 측면에서의 지형분석 체계를 정립하였으며, Tamura(1974)는 산지 내 소유역 단위의 미지형을 체계화함으로써 산지사면 붕괴에 관련된 단위사면의 특징을 구분한 바 있다. 항공사진측량 분야에서는 산사태 발생 관여 요소에 대한 경중률 조사 수단 및 입체시에 의한 판독도 제작을 위한 자료로서 활용된다. 실례로 Yagi and Higaki(2009)는 항공사진을 활용하여 경중률 조사를 통해 재해 후의 산사태 발생지 위치와 개소수를 파악하였고, Hasegawa and Ohta(2009)는 판독도 제작을 통해 재해 후의 산사태 발생지를 DB화하는데 활용하였다.
한편, 최근에 수행된 해외의 연구에서는 항공사진의 활용기법 중 수치도화기(Soft photogrammetry)를 이용한 자료조사방법을 제안하고 있다. 즉, 정사보정된 디지털 항공사진의 활용잠재성이 높아지면서 항공사진의 스테레오 모델, 항공사진과 수치지형도, 항공사진과 DEM을 입체시하거나 중첩하여 분석하는 방법이다(Hasegawa and Ohta, 2013; Kang et al., 1993; Kim and Jang, 2014).
전통적으로 항공사진이 활용된 토지이용 분석, 식생조사 및 분류와 달리 방재지형학적 측면의 미지형 분류는 항공사진판독요소를 적극적으로 활용해야 할 뿐만 아니라 수치지형도 등을 이용하여 특정의 산지사면과 그 주변부의 지형을 종합적으로 이해해야 하는, 지형학적 지식이 크게 요구되는 판독행위이다. 이러한 종합적 지식활용을 전제로, 이 연구에서는 정사 항공사진과 수치도화기(DSP Master ver. 1.5)를 이용하여 미지형 판독절차, 판독지표 및 도면화 체계의 제시와 적합성 검토를 실시하였다.
3. 연구절차 및 방법
3.1 연구절차
이 연구는 Fig. 1과 같이 현장조사와 실내조사를 통하여 연구대상지를 설정하였고, 이후 미지형판독에 사용될 판독지표를 선정하였다. 다음으로 선정된 판독인자를 연구대상지에 적용하여 판독을 실시하였으며, 그 결과를 관리도면으로 작성하였다. 최종적으로 이 과정을 미지형 판독 기법으로 체계화하였다.
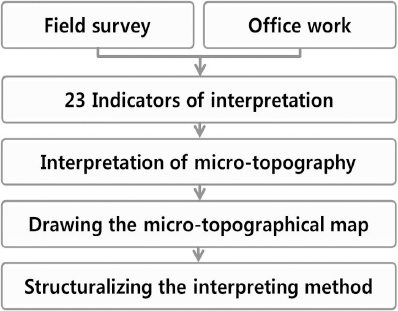
Research Procedures
3.2 연구대상지
연구대상지는 2011년 7월 27일 토사재해가 발생한 서울 우면산 일원이다. 재해 당시 우면산 일원에서는 인명피해 67명, 재산피해 주택파손 11세대, 침수 3,687건 등이 발생하였다(Yoo et al., 2014).
이 연구에서는 항공사진 적용의 적합성 판정을 위해 기존의 재해조사보고서 등을 활용하여 1차 판독 개소수를 결정한 후, 현장조사와 항공사진을 통해 개소수를 확정하였다. 그 결과 우면산 일원에는 41개소의 소유역에 걸쳐 126개소의 붕괴지가 식별되어 소유역당 평균 3.1개소 정도의 사면붕괴가 발생된 것으로 파악되었다.
3.3 미지형 판독자료
미지형 판독을 위한 연구 자료는 ① 항공사진, ② 1:5000의 수치지형도 및 ③ 5×5 m 격자 크기의 수치표고모델(DEM)이며, 판독 및 도화는 수치도화기(DPS Master ver. 1.5)를 활용하였다. 항공사진 자료는 2011년 우면산 토사재해 발생 이전과 이후 자료를 확보하여, 각각 사면붕괴 발생의 전조현상(전)과 그에 따른 붕괴여부(후)를 비교할 수 있도록 하였다. 재해발생 전에 촬영된 항공사진은 ADS Line 방식의 항공사진 78도엽으로 스테레오 모델을 형성하였고, 발생 후에 촬영된 항공사진은 CCD Frame 방식의 항공사진 24매로 스테레오 모델을 형성하였다.
4. 판독지표의 선정과 적용
4.1 관련연구 사례조사
산지 토사재해 관련 판독지표 선정을 위해 국내외 관련 사례를 조사하였다. 그 결과 일본의 경우 지형학(Suzuki, 1997;Tamura, 1974), 지형공학(Imamura, 2012) 및 미지형판독(Ooishi, 2014)의 선행연구자료가 확인되었다. 또한 일본은 지형(공)학 지식과 기법이 체계화되어 있었으며, 나아가 지형분류도, 토지조건도 등의 광역미지형분류도와 사방기반도, 미지형분류도 등의 상세미지형분류도를 제작하고 있었다(Okimura and Miyagi, 1991; Fukasawa et al., 2011; Iida et al., 2006; Hagiwara and Nobata, 2015). 국내의 경우에는 사방지 및 토사재해지 조사시 미지형 분석 개념이 부분적으로 적용되어지고 있는 것으로 알려져 있다(Kim, 1995).
4.2 선행연구의 판독인자 추출
우리나라 산지에 적용 가능한 지표를 확정하기 위해 일본의 선행연구사례와 미지형분류도로 판독지표를 추출하였다. 일본에서 활용되는 많은 미지형 지표 중 지형형성 특성의 차이에 의해 우리나라에서 나타나지 않는 지표를 제외한 지표군을 구성하고, 이를 기초로 사방공학 분야의 전문가들로부터 자문을 받아 18종의 판독인자와 5종의 필수개념 등 총 23종을 정리하였다(Table 1).
Indicators for Micro-topography Interpreting in the Prior Study
4.3 판독인자의 적절성 검토 및 판독지표의 확정
Inagaki and Yanagida(2003)는 토석류와 관련된 지형지표를 상세미지형분류도와 토석류재해도 등에서 확인하여 적절성을 점토하였다. 이때 토석류는 애추(Talus)가 존재하는 지형 및 천급선이 위치하는 요지(Depression), 와지(Hollw)등에서 토석류가 발생하였다(Fig. 2). 따라서 이 연구는 국외사례를 기초로 우면산의 토석류 피해지의 상세미지형분류도와 산사태재해도를 시범 제작하여 판독인자(Table 1)와의 관련성을 확인하였다(Fig. 3). 그 결과 토석류가 주로 발생한 지형은 천급선(Convex knick Line) 아래 위치한 와지로서 지표의 적용이 유효한 것으로 판단되었고, 18종의 판독인자와 5종의 필수개념을 포함하는 총 23종의 판독지표를 확정하고 상세조건을 정리하였다(Table 2).
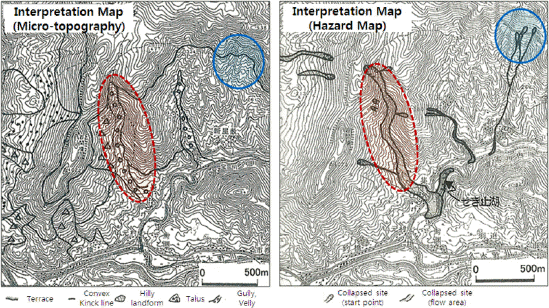
Study Case by Inagaki and Yanagida (2003)
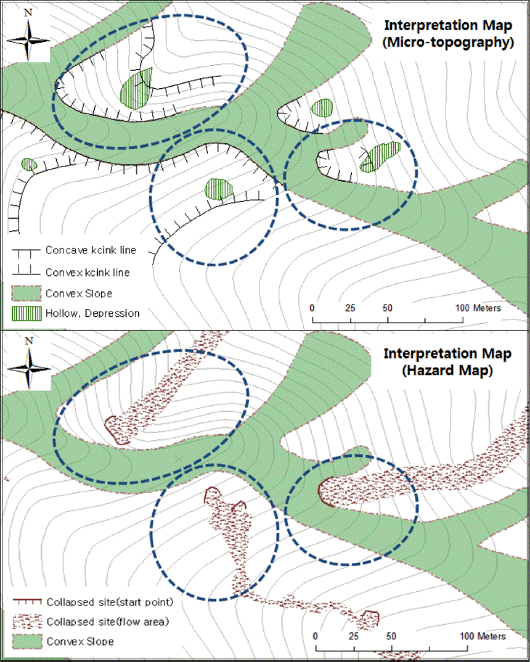
Validity of Micro-topography Interpreting Index
Twenty-three Types of Micro-topography Interpreting Indicators
5. 판독 환경 및 절차
5.1 판독환경의 구축
일반적으로 지형판독은 대상지의 항공사진, 스테레오 모델 및 지형도, DEM 등의 자료를 활용하여 진행한다. 이 중에서 스테레오 모델은 항공사진의 중복도를 이용하여 형성하며, 입체시에 의해 입체감을 얻게 된다. 이 논문에서는 이러한 스테레오 모델을 이용하여 판독환경을 구축하였으며, 그 절차는Fig. 4와 같이 항공사진 및 데이터 입력, 정사보정, 스테레오모델 형성, 지형도와의 중첩, 도화 순으로 진행되었다.
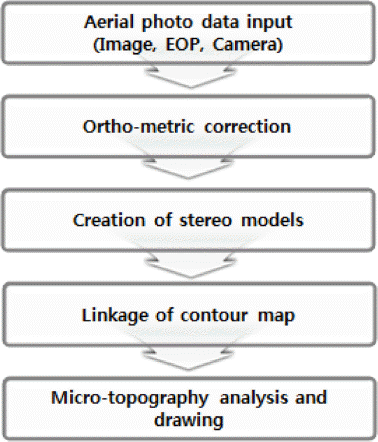
Procedure for Construction of Digital Aerial Photos Database
5.2 지형판독에 이용되는 주요 요소
일반적으로 자원 및 환경 등의 조사에 이용되는 사진판독의9요소는 색조(tone), 형태(pattern), 질감(texture), 크기(size), 형상(shape), 음영(shadow)의 6개 기본요소와, 과고감(vertical exaggeration), 상태(situation), 위치(location)의 3개 보조요소로 구성된다(Kang et al., 1993; Kim, 1976). 이 연구에서는 이들 9요소를 활용하였으며, 특히 크기, 형상, 과고감을 주로 조합하여 미지형 판독을 실시하였다.
5.3 판독의 절차
지형판독은 연구대상지 전체에 대한 개황판독과 상세판독으로 구분된다. 먼저 개황판독에 의해 우면산 일원의 표고, 지세, 능선과 곡의 위치와 발달 방향을 파악하고 이를 기반으로 소유역을 구분하였다. 다음은 소유역 단위의 침식지형, 변형지형, 인공지 등 토사재해 관련지표를 판독하였고, 소유역을 산지사면을 제외한 판독인자의 판독 기본단위로 설정하였다.
지형 판독을 실시한 결과 18종의 판독인자 5종의 필수개념 중 9종의 판독인자가 판독되었고, 4종의 필수개념이 확인되었다(Table 3).
Results of Micro-topography Interpretation
5.3.1 산지사면의 판독
산지사면의 판독은 능선, 골짜기, 직선형 사면 순으로 진행하였다. 능선형사면은 산정부에서 산맥을 따라 아랫방향으로 판독하였으며, 골짜기형 사면은 유역의 시작 기준점으로부터 산정부 방향으로 판독하였다(Fig. 5). 직선형 사면은 능선형사면과 골짜기형사면 사이에 위치하나, 우면산을 대상으로는 거의 판독되지 않았다.

Examples of Interpreting the Micro-topography(Slope)
산지사면의 판독시 주로 과고감, 상태, 위치 등의 요소를 활용하였으며, 능선형사면과 골짜기형 사면의 경계는 능선에서 골짜기로 변환되는 지점의 경사변환선으로 결정하여 판독하였다.
5.3.2 침식지형, 변형지, 인공지형의 판독
우면산을 대상으로 침식지형, 변형지, 인공지형 등을 판독한 결과 요지 및 와지, 인공구조물, 절토면, 성토면, 붕괴지, 평탄화지 등이 판독되었다.
산지사면을 제외한 판독 기본단위인 소유역은 0차곡과 1차곡으로 구성되어 있었으며, 이때 와지 및 요지는 0차곡 또는1차곡의 접합지점에 위치하였다. 와지의 크기는 평균적으로 120 m2로서 1/5000의 지형도에는 나타나지 않는 경우가 많았고, 중첩화면 내에서 과고감, 크기, 색조 등으로 판독하였다.
인공구조물은 산지 내 위치한 임도, 등산로, 휴양시설 등으로 나타났으며, 임도 및 등산로는 총 9,894 m, 휴양시설 및 기타 시설은 19개소로 평균 204 m2이었다. 임도는 지형도상에 도로의 형태로 나타났지만, 등산로와 휴양시설은 지형도상에 나타나지 않았다. 따라서 인공구조물의 판독 또한 수치도화기를 활용한 항공사진과 지형도의 중첩분석이 필요한 것으로 판단되었으며, 주로 색조, 형태, 형상 등의 요소로 판독하였다.
절토지 및 성토지는 주로 인공구조물 하부 또는 상부에서 판독되었다. 절토지는 2개소가 판독되었으며 평균 면적이 13,612m2이었고, 성토지는 총 11개소로서 평균적으로 3,685m2이었다. 절토지 및 성토지는 인공구조물 하부 또는 상부에 급경사의 형태로 나타났다. 판독은 과고감, 상태, 위치 등의 요소를 활용하였다.
평탄화지는 산지 내 묘지 또는 경작지, 생태공원 등이 판독되었으며, 총 82개소 평균면적 535 m2로 나타났다. 평탄화지는 지형도만을 활용하여 판독이 가능하였으나, 정확한 면적과 형태를 알기 위해서는 사진과의 중첩판독이 필요하였다.
수해가 발생하기 전 붕괴지는 20개소가 판독되었으며, 평균 면적은 다른 판독인자와 비교하였을 때 가장 작은 면적인 45 m2을 보였다. 따라서 붕괴지 판독은 중첩판독이 필요하며, 주변과의 색과 형태를 비교하여 판독하였다.
5.3.3 필수개념의 판독
필수개념의 판독결과 소택지, 계류, 천급선과 천완선이 판독되었다. 소택지는 우면산 생태공원의 저수지가 판독되었으며 면적은 2,576 m이었다.
계류 판정은 그림 7과 같은 개념으로 판독하였다. 계류의 0차곡과 1차곡의 결정은 깊이(A)와 너비(B)를 비교하여 설정한다. A가 B보다 길면 1차곡, 짧으면 0차곡으로 구분한다(National Institute for Land and Infrastructure Management, 2007).
천급선, 천완선의 판독은 그림 8과 같은 개념으로 판독하였다. 우선 유역 내 계류를 따라 횡단면(a) 설정한다. 횡단면(a)가 그려지면, 계류의 최상부와 최하부를 이은 선(b)를 그린다. 이 때 선(b)에서 선(a)로 직교하는 지점을 찾았을 때 양의 값을 나타내는 최고점은 천급점(A), 음의 값을 나타내는 최고점은 천완점(B)이 된다. 천급선과 천완선은 천급점과 천완점을 각각 이은 점이 된다.
필수개념의 판독은 지형도만 활용하여 판독이 가능하였지만, 중첩화면 내에서 실제 지형과 비교하여 판독의 정밀도를 높여주었다.
6. 기호화 및 도면제작
6.1 판독인자의 기호화
판독인자를 점·선·면으로 기호화하여 도화하는 것은 판독인자를 활용하고 분석하기 위해 매우 중요한 절차이다. 판독인자의 기호화는 판독인자의 특징을 상상할 수 있도록 고안하는 것이 일반적이며 이해와 식별이 쉽고 형태가 단순하고 분명해야한다(Beom. 2013). 지형요소의 기호화에 관련된 선행연구는 Kim et al.(2014)에 의해 제시되었다. 선행연구는 산지와 관련된 지형요소를 점, 선, 면으로 구분하여 도면화하였다. 선행연구에서 판독지표의 기호를 확인한 결과 와지, 오목사면, 볼록사면, 하천 등을 확인할 수 있었다. 선행연구에서는 이 판독지표를 점 또는 선으로 표기하였으나, 이 연구에서는 면적산출과 형태의 확인을 위해 경사변환선과 수계를 제외한 판독지표를 면의 형태로 제시하였다(Table 4).

Symbol of Micro-topography
6.2 관리도면의 제작 및 활용
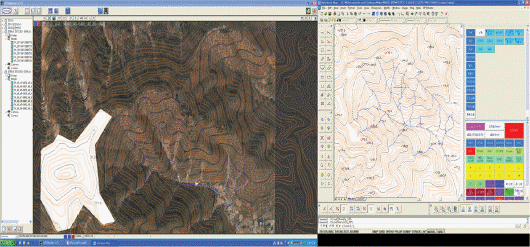
관리도면은 수치도화기에 연동된 CAD 프로그램을 활용하여 제작하였다. 또한 관리도면의 기호는 6.1 판독인자의 기호화에서 제시된 기호를 활용하였으며, 기호는 수치도화기의 기능을 이용하여 면의 형태로 지정해 주었다(Fig. 9).
Overlaped Screen of the Stereo Model and Digital Terrain Map

Examples of Interpreting the Micro-topography (Eroded Land, Deformed Land and Artificial Structures)
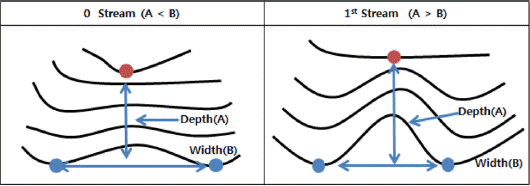
Decision of the 0, 1 Stream
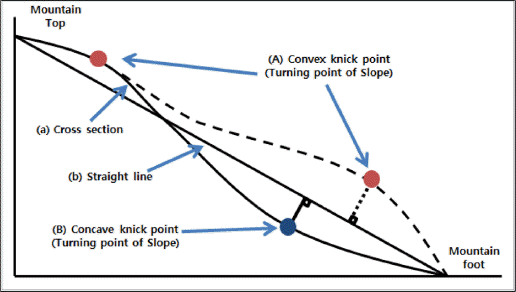
Setting The Turning Point of Slope
관리도면은 대상으로 하는 산지의 토사재해의 가능성이 있는 인자들이 포함되어 있어 추가적인 지형분석 및 통계작업에 활용 될 것으로 판단되었다(Fig. 10). 또한 대상으로 하는 산지의 개략적인 지형과 지형인자들의 관계를 파악할 수 있어 산지 관리에 활용 될 것으로 판단된다.
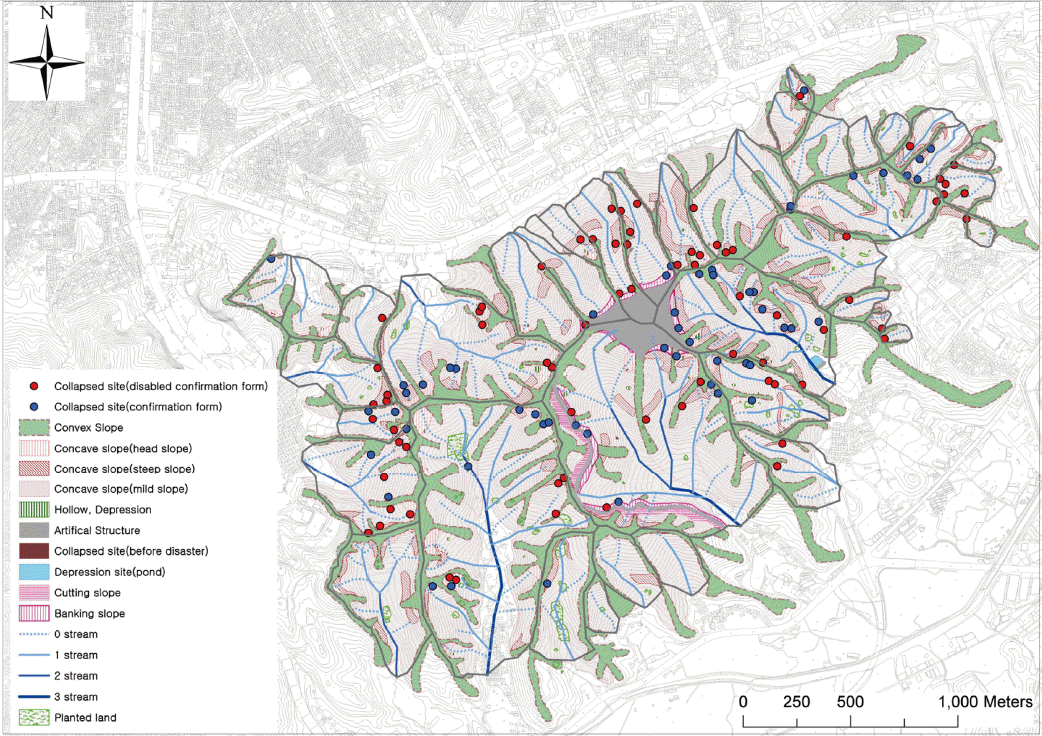
Example of Interpretation Map (Mt. Umyeon)
7. 결론
이 연구는 항공사진을 활용한 미지형분석 기법과 체계를 소개하였다. 미지형 분석은 판독지표의 선정, 판독의 절차, 도면화 작업으로 분류하였고, 다음과 같은 결과를 얻었다.
판독지표의 선정은 토사재해와 관련 있는 미지형지표를 선행연구에서 조사하여 정리하였다. 판독지표는 18종의 판독인자와 5종의 필수개념을 포함하였고, 상세미지형분류도와 산사태 재해도를 시범제작하여 판독인자와 토사재해의 관련성을 확인할 수 있었다.
판독의 절차는 판독환경의 구축, 지형판독의 방법, 지형판독으로 구분하여 소개하였다. 미지형 판독은 소프트 도화기 상에서 스테레오 모델과 수치지형도의 중첩분석을 통해 이루어졌으며, 판독결과 13종의 지표 및 필수개념이 확인되었다. 판독지표 및 필수개념은 지형도상에서 명확하게 나타나지 않아 미지형판독에서는 중첩분석이 효율적인 것으로 파악되었다.
도면화 작업은 도면화 작업을 위한 기호의 선정, 관리도면의 제작 및 활용방법으로 구분하여 제시하였다. 기호의 선정결과 경사변환선과 수계를 제외한 판독지표에 대해 면의 형태의 기호를 제시할 수 있었다. 관리도면의 제작 결과 관리도면은 대상으로 하는 산지의 개략적인 지형파악과 향후 연구의 기초자료로 활용될 것으로 판단되었다.
감사의 글
이 연구는 국토교통부/국토교통과학기술진흥원 국토교통기술연구사업(과제번호: 14SCIP-B069989–02)의 연구비지원에 의해 수행되었습니다.


