Experimental Study on the Spread Characteristics of Initial Fires According to Corridor Types
Article information
Abstract
During an accidental fire in buildings, the corridor becomes the path for flame and smoke to spread, exposing the occupants to danger. Therefore, this study conducted real-scale fire experiments using corridors of size 2.4(L) × 10(W) × 2.4(H) m an “L-type” corridor for one-way evacuation and a “T-type” corridor for two-way evacuation to analyze the characteristics of fire according to the shape of corridors. The real-scale fire experiments were conducted in a fire room (2.4(L) × 3.6(W) × 2.4(H) m) with a single opening (2.0(W) × 1.8(H) m). The combustibles used inside the fire room were wood cribs, with a heat release rate of 651.4 kW, in the L-type corridor and chairs, with a heat release rate of 95.7 kW, in the T-type corridor. The temperature inside the corridor was measured during the real-scale fire experiments, and the average maximum measured temperature was 432.1 °C in the L-type corridor and 103.5 °C in the T-type corridor. The experimental results and the ventilation characteristics according to the corridor types were applied to BFD curves to show the process of designing fire growth models according to corridor types.
Trans Abstract
건축물에서 화재 발생 시 복도는 화염과 연기의 확산 통로가 되어 재실자가 위험에 노출될 수 있다. 따라서 본 연구에서는 복도의 형태에 따른 화재의 특성을 분석하기 위해서 단방향 피난이 가능한 ‘L’ 형태와 양방향 피난이 가능한 ‘T’ 형태의 복도를 2.4(L) × 10(W) × 2.4(H) m 크기로 제작하여 실물화재 실험을 진행하였다. 실물화재 실험은 2.0(W) × 1.8(H) m 크기의 단일 개구부를 가지고 있는 2.4(L) × 3.6(W) × 2.4(H) m의 화재실에서 진행되었으며, 화재실 내부의 가연물은 ‘L’ 형태에서는 열방출률이 651.4 kW인 목재크립을 사용하고 ‘T’ 형태에서는 95.7 kW인 의자를 사용하였다. 실물화재 실험에서는 복도 내부의 온도 변화를 측정하였고 이른 통해 측정된 온도의 평균 최대값은 ‘L’ 형태에서 432.1 ℃로 ‘T’ 형태에서는 103.5 ℃로 나타났다. 또한, 실물화재 실험의 결과와 복도의 형태에 따른 환기특성을 BFD 곡선식에 적용하여 복도의 형태에 따른 화재성장 모델의 설계 과정을 제시하였다.
1. Introduction
More than 40,000 fire accidents occur in buildings every year, resulting in more than 2,000 casualties each year (National Fire Agency, 2021). Fire accident occur and spread according to various causes and complex situations, so it is difficult to prevent damage in advance. In recent, therefore, fire protection measures and technologies are being developed in fire spread prevention, smoke and evacuation safety, structural fire resistance and fire fighting systems to reduce casualties and damage to properties.
In particular, preventing the spread of fires in the early stage is significant for the safety of occupants in buildings, and performance-based fire safety design also focuses on corresponding models with fire scenarios in design fires (Yoo et al., 2011; Kim et al., 2013). Fire safety systems in buildings are divided into prescriptive-based fire safety designs centered on existing legal systems and performance-based fire safety designs customized to the target buildings. Currently in Korea, performance-based fire safety design techniques has been only introducing in the ‘fire part’ also the ‘architecture part’ are being discussed institutionalization plans.
Prescriptive-based fire safety standards and designs are universal and easy to apply to the fields because they establish a system suitable for each country’s characteristics based on the risks identified in fire accidents and secure fire safety through them. However, they do not reflect specific fire hazards in target buildings. On the other hand, performance-based fire safety standards and designs configure fire accidents that may occur in target buildings in advance through design fires for fire safety engineering and then perform optimal protection design to ensure customized fire safety. This process needs to consider complex and various fire hazard factors. Therefore, many countries apply prescriptive-based fire safety standards but some buildings that are likely to cause many casualties and property damage if specific fire hazards occur, such as high-rise buildings and large spaces use alternative design methods (Performance-Based Fire Safety Design).
Fire scenarios used in performance-based fire safety are applied in accordance with or similar to the existing fire safety standards in each country, and in certain designs, they are developed by consulting with public officials and fire safety experts. Performance-based fire safety designs require fire engineering analysis by fire safety experts under prior cooperation and approval with relevant authorities such as public officials (ISO/DTR 20413, 2019). In Korea, the standards for design fires are presented in Annex Table 1 of the ‘Criteria for preparing scenarios for fire and evacuation simulations’ of the National Fire Agency Notification No. 2017-1 “Performance-based design methods and standards for fire fighting facilities.”
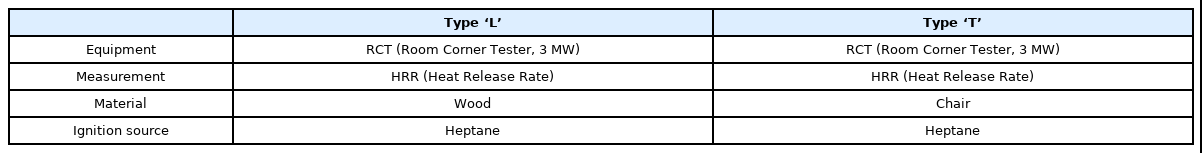
HRR Test Scenarios
Fire scenarios in performance-based fire safety design present a set of conditions that define the growth of fires and the spread of combustion products throughout or part of a building. These scenarios consist of ① identifying possible fire scenarios →② identifying design fire scenarios (a subset of possible fire scenarios) →③ characterizing design fire scenarios →④ quantifying design fire growth curves (NFPA and SFPE, 2007).
Fire growth is divided into the growth stage, fully developed stage and decay stage, and predicting the occurrence and time of deadly flashover is significant. Flashover refers to a thermally driven event when the temperature inside a compartment rises as the fire growth and the upper layer of smoke and gas expands to the lower layer, thereby heating the surface and exposing the entire space to radiant heat. Flashover normally occurs at 600 ℃ and an incident heat flux at floor level of 20 kW/m2 (Buchanan, 2001).
As mentioned above, predicting fire growth in building is a starting point for fire protection, but there are many challenges in fire engineering because various factors such as combustibles and ventilation characteristics of the compartment must be considered. Therefore, computer analysis programs are used, such as Fire Dynamic Simulator (FDS), but the results and reliability change depending on the initial input data. Real-scale fire experiments data are used to solve this problem, but there is still insufficient data. Therefore, this study conducted real-scale fire experiment to analyze the temperature characteristics of fire growth inside corridors to address this issue.
2. Real-Scale Fire Experiment Method
2.1 Real-Scale fire experiment scenario
Among various methods for predicting fire growth rate in buildings, the “T-Squared Fire” is widely used in Korea and other countries. The T-squared fire is divided into four modes (slow, medium, fast, ultra-fast) according to the fire growth coefficient proportional to time squared. In particular, T-squared fires are divided into slow (600 s), medium (300 s), fast (150 s), and ultra-fast (75 s) based on the amount of time taken to reach 1,055 kW (Choi and Yoon, 2016). Although fire growth coefficients for buildings vary by literature, most use residential buildings (medium), education and work (medium), and shopping centers (fast) (BSI, 2003).
When combustibles are ignited in a compartment, flames spread to adjacent combustibles or interior finishing materials through combustion reactions, and the fire spreads through openings, such as windows and doors, after the fire grows in the interior space. This shows the process of fuel-controlled fires, which are affected by the amount and density of combustibles in the internal space in the early stage, changing into ventilation-controlled fires affected by the amount of ventilation through growth. Fig. 1 (Matsuyama et al., 1998) illustrates how the characteristics of fires change with the heat release rate. Qc1 represents a fuel-controlled fire, and Qc2 represents a ventilation-controlled fire, and (a) shows the time point (about 5 minutes) when fuel-controlled fires turn into ventilation-controlled fires or a flashover.
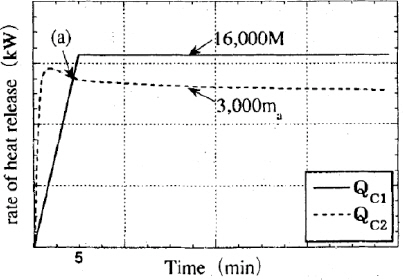
Transient Change of Rates of Heat Release
The spread of fire in building is caused by fire severity, such as the Heat Release Rate (HRR) or temperature effect within a compartment, fire duration due to fire loads, and the spread of flames through doors, windows, and other openings (Cheng and Hadjisophocleous, 2011). Smoke and heat spread through corridors and stairs, except for cases when flames spread from where the fire broke out to outside spaces such as windows. Corridors and stairs become the path for flame and smoke to spread, and may seriously affect the safety of occupants if they use these spaces as evacuation routes. Therefore, this study conducted real-scale fire experiment by constructing a T-type corridor for two-way evacuation and an L-type for one-way evacuation to analyze the characteristics of fires according to the corridor types.
2.2 Real-Scale fire experiment planning
The real-scale fire experiments were conducted by measuring the temperature of the smoke generated by burning combustibles in a fire room with a single opening. The HRR of the combustibles inside the fire room was measured before starting the experiment. Table 1 shows the HRR experiment scenarios, and Fig. 2 shows photos of the experiment. The HRR measurement experiment used wood and chairs as initial combustible materials and used heptane to ignite them.
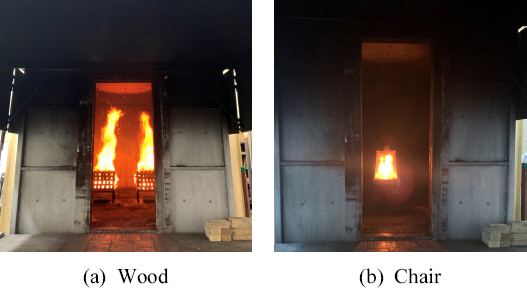
HRR Test Photos
The Room Corner Tester (RCT) is a calorimeter that measures the HRR using the oxygen consumption method. The oxygen consumption method begins with the basic principle that 13.1 MJ/kg of heat is generated when 1 kg of oxygen is consumed, based on the fact that the net heat of combustion is proportional to the amount of oxygen required for combustion, and the resulting heat release rate is as follows. Eq. (1) is applied when measuring only the oxygen concentration in the exhaust gas, and Eq. (2) is applied when measuring the concentrations of oxygen, carbon monoxide, and carbon dioxide in the exhaust gas (Babrauskas and Grayson, 1992; Choi et al., 2008). where, ∆hc /r0 =13.1 kJ/g, C is the calibration constant, ∆P is the pressure difference between the two ends of the orifice, and Te is the exhaust gas temperature. The superscript 0 indicates the state before combustion.
Fig. 3 shows the results of measuring the HRR. In the HRR experiment of wood, the HRR increased rapidly due to the combustion reaction of heptane, the source of ignition, and then the flames spread to the wood. The maximum HRR of wood was 651.4 kW at 14 minutes and 39 seconds after starting the experiment. In the HRR test of a chair, gauze containing heptane was placed on the bottom of the chair as the source of ignition, and the maximum HRR was 95.7 kW at 3 minutes and 9 seconds after starting the experiment. As shown in Fig. 4, the real-scale fire experiments were conducted by fabricating ‘L-’ and ‘T’-type corridor compartments with one fire room. The two compartments contain a 2.4(L) × 3.6(W) × 2.4(H) m fire room with a single opening (2.0(W) × 1.8(H) m). Both compartments have a 2.4(L) × 10(W) × 2.4(H) m corridor, and the L-type corridor is only open on one side to allow only one-way evacuation, while the T-type is open on both sides for two-way evacuation.
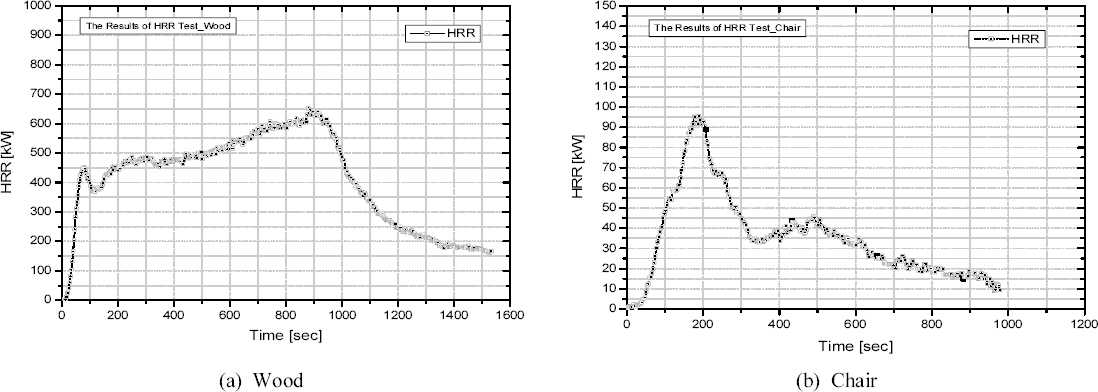
HRR Test Results
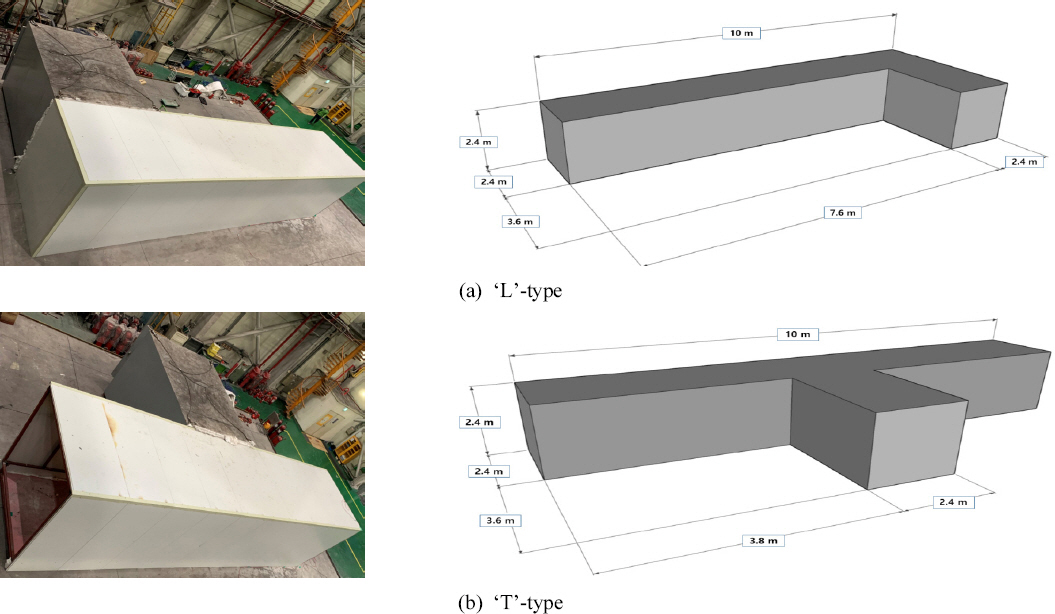
Compartment Mock-Up
Fig. 5 shows the locations of the K-type thermocouples used to measure the temperature in the real-scale fire experiment. Fig. 5(a) shows the plan, and Fig. 5(b) shows the elevation, where the thermocouples are configured in the shape of a tree. For example, in tree A-1, the thermocouples were installed at 5 points (A1_1~5) by height (2.4 m, 2.1 m, 1.8 m, 1.5 m, 1.2 m). Accordingly, the temperature was measured at 60 points; 30 points on line A (A1~6), and 30 points on line B (B1~6).
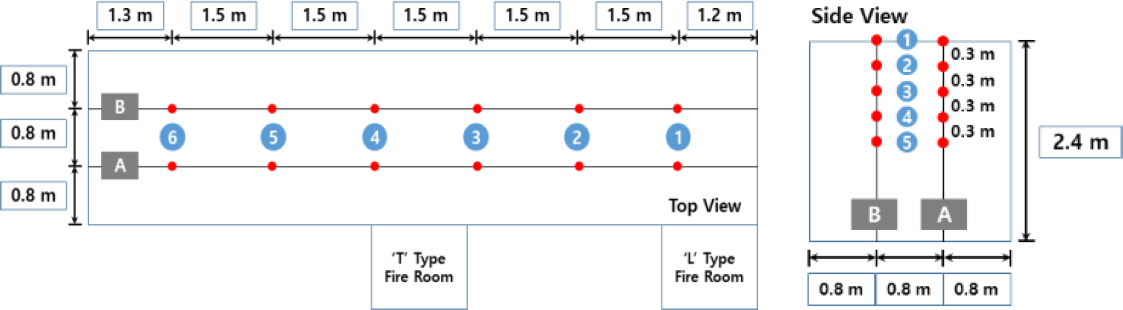
Position of Thermocouples
3. Real-Scale Fire Experiment Results
The real-scale fire experiments using compartment with L- and T-type corridors took 25~30 minutes after ignition.
Figs. 6~8 show photos of the experiment. As shown in Table 1, wood cribs with a maximum HRR of about 650 kW were used as combustibles in the L-type corridor experiment, and chairs with a HRR of about 100 kW were used in the T-type corridor experiment.

Experiment Set-Up
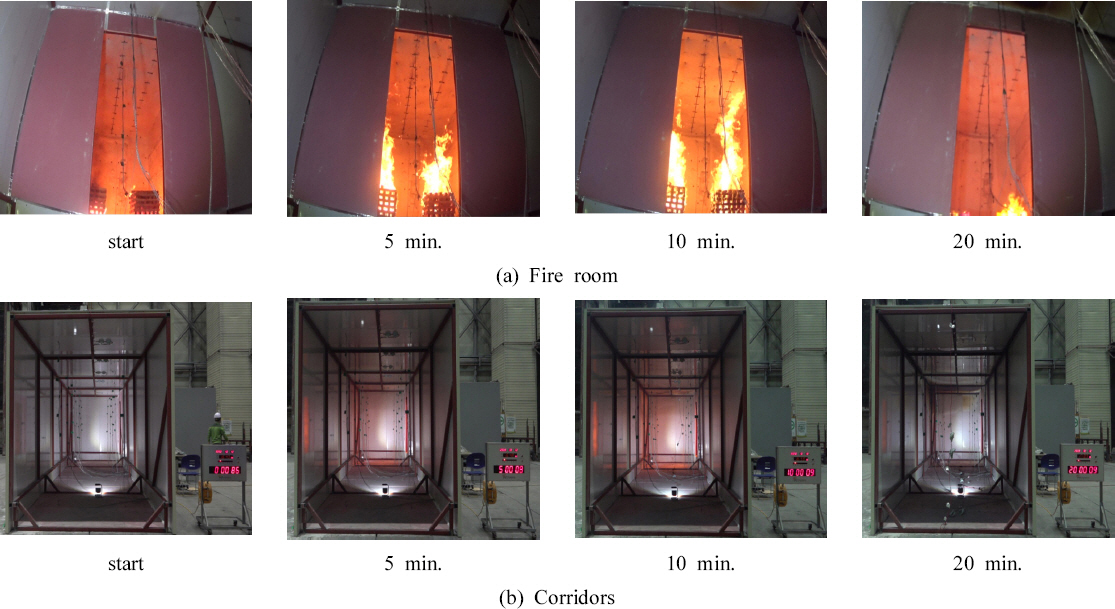
Real Scale Fire Experiment_‘L’-Type
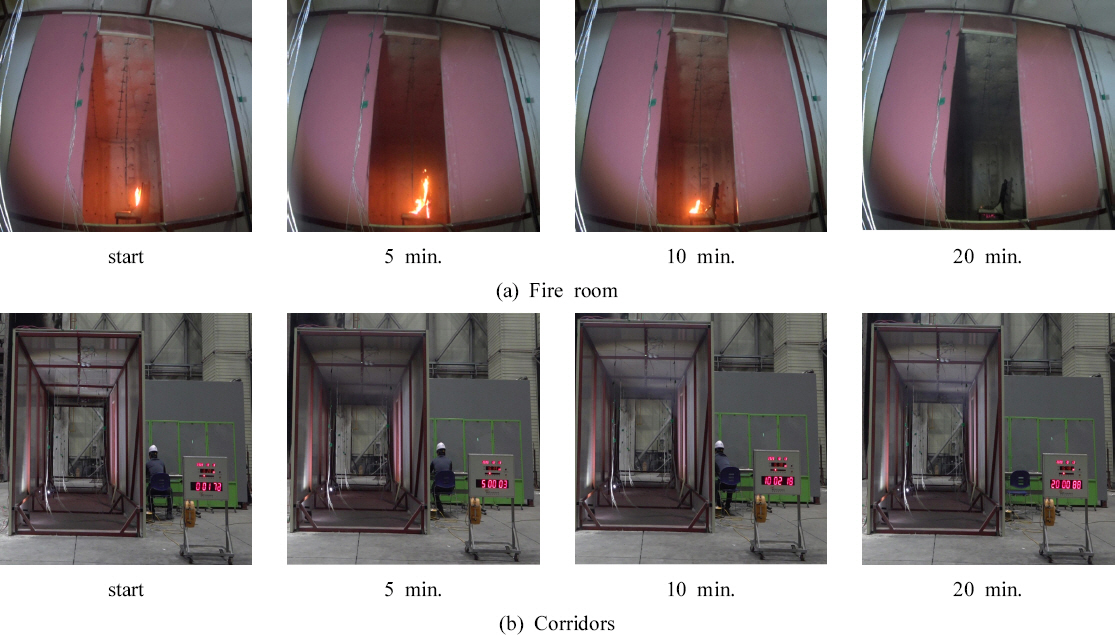
Real Scale Fire Experiment_‘T’-Type
The real-scale fire experiments were conducted under a pre-flashover state where occupants can evacuate safely; not in a post-flashover state that could cause damage to the building structures in the event of a fire. The conditions which infer the occurrence of flashover (Kweon et al., 2012) include a HRR of 1 MW, a heat flux at a floor of 20 kW/m2, a critical ceiling temperature of 600 ℃, and the emergence of flames from the opening, but flames did not propagate from the opening during the experiments. A door to ignite the heptane was installed at the rear of the fire room, and the room was sealed after ignition to direct the flames and smoke toward the corridor. Then, the temperature change caused by the flames and smoke through the corridor was measured.
Figs. 9 and 10 show the temperature change measured during the real-scale fire experiments, and Table 2 shows the maximum temperature, the time it takes to reach the maximum temperature, and the average values of lines A and B for each type of corridor. In the L-type corridor, the fire decreased after the fire growth process (after about 15 minutes from starting the experiment), and in the T-type, the fire decreased 5 minutes after starting the experiment. In terms of temperature, there was a difference in maximum temperature depending on the calorific values of the combustibles. Differences in temperature growth were also observed depending on the shape of the corridor. The temperature inside the T-type corridor increased rapidly because both ends were open, which shows that the state (open/closed) of openings during early fires in buildings affects the spread of flames and smoke.
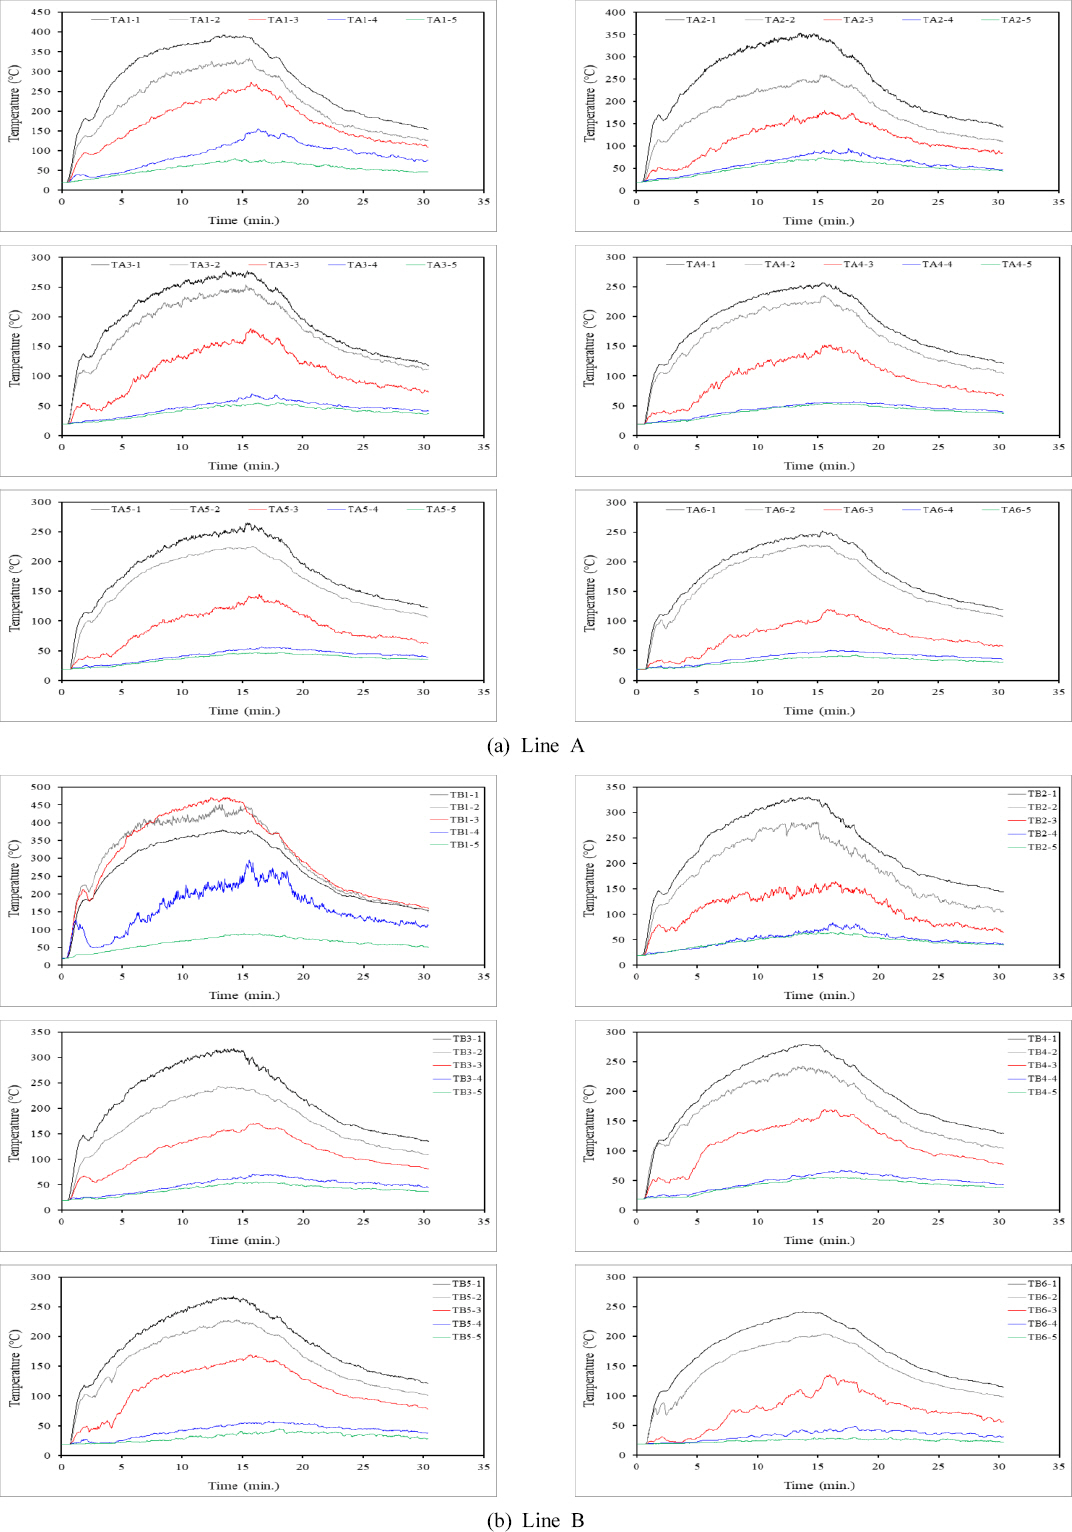
Results of Real Scale Fire Experiment_‘L’-Type

Results of Real Scale Fire Experiment_‘T’-Type
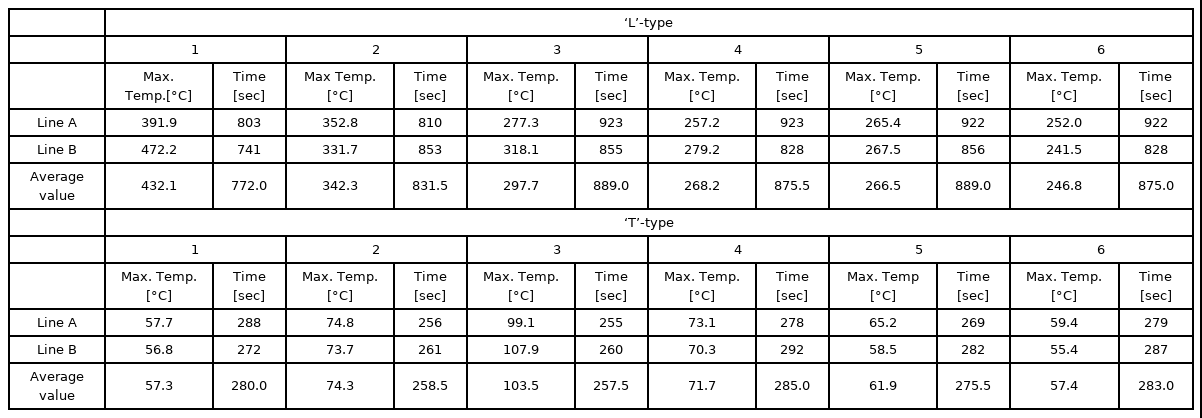
Max. Temperature & Time
The maximum temperature in the L-type corridor was 472.2 ℃ measured at point 1 of line B adjacent to the opening of the fire room, and it took 741 seconds to reach the maximum temperature. The temperature at each point gradually decreased from point 1. The maximum temperature at point 6 of line A, the end of the open corridor, was 252.0 ℃, and it took 922 seconds to reach the maximum temperature. The average maximum temperature was 432.1 ℃ at point 1 measured at 722 seconds. The maximum temperature in the T-type corridor was 107.9 ℃ measured at point 3 of line B near the opening of the fire room, and it took 260 seconds to reach the maximum temperature. The temperatures at both ends of the corridor (point 1 of line A & point 6 of line B) were 57.7 ℃ measured at 288 seconds and 59.4 ℃ at 279 seconds, respectively. The average maximum temperature was 103.5 ℃ at point 3 measured at 257.5 seconds.
Various methods to obtain fire models are available based on the temperature data measured through real-scale fire experiments, and this study presented a fire model by applying the experiment results to BFD curves (Barnett, 2002; Kristin, 2007; Kweon, 2016) based on the results of more than 142 fire experiments. Kweon (2016) analyzed the growth of temperature through real scale fire experiments about post-flashover in compartment and that in this study analyze temperature growth in corridors through real scale fire experiments about pre-flashover in corridors with openings.
Barnett (2002) developed a single log-normal equation (BFD curve) as a new empirical model for fire compartment temperatures. Barnett (2002) proposed a simple model of the temperature-time fire development in which only three factors are re quired: maximum gas temperature, the time at which this maximum temperature occurs, and a shape constant for the curve. Based on a large amount of data correlation using BFD curves he recommended this simple equation can be used to re place international temperature-time curves such as ISO 834, BS 476, ASTM 119, NFPA 251, the external, the hydrocarbon, and the Eurocode parametric curve (Qiang et al., 2010).
A BFD curve is calculated by the equation below, where Tg is the temperature over time (℃),Ta is the initial temperature (℃), Tm is the maximum temperature (℃), tm is the at which Tm occurs (min), and Sc is the shape coefficient.
The shape coefficient Sc is as follows when the compartment is insulated.
Table 3 shows the real-scale fire experiment results applied to the BFD curve. Temperature measurement trees were installed on lines A and B during the fire experiments according to the corridor types, and the average temperatures measured on lines A and B were applied to the BFD curve. The initial temperatures in the L- and T-type corridors were 20 ℃ and 18 ℃, respectively. The maximum temperatures were set as 432.1 ℃ and 103.5 ℃, respectively, the average maximum temperature in lines A and B, and the average time to reach the corresponding temperature was also applied to the BFD curve. The shape coefficient is expressed as a function of the ventilation coefficient (

BFD Curve Factor Values
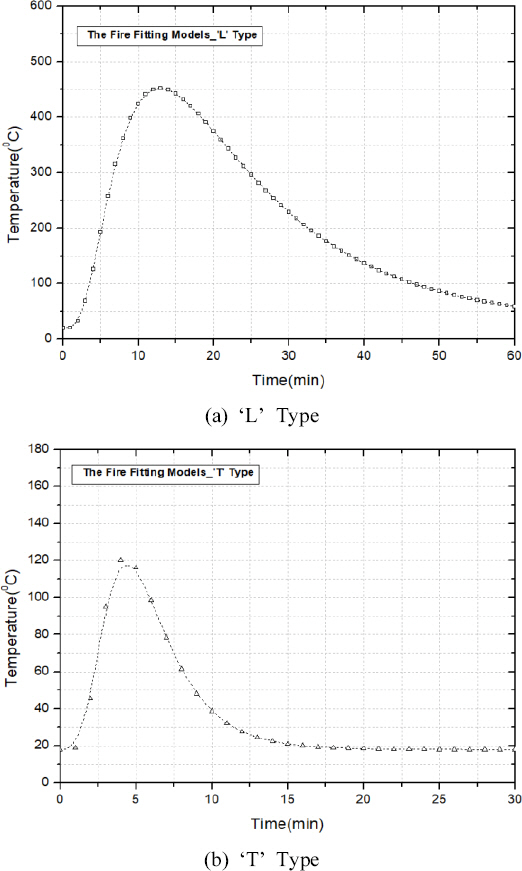
The Models about Results of Fire Experiments
4. Conclusion
This study conducted real-scale fire experiments and presented fire models by applying the experiment results to BFD curve to analyze the growth of fires before flashover, the period of fire growth with severe casualties in the event of a fire in buildings.
When a fire breaks out in a building, various types of fire growth characteristics appear in the fire room. However, in the case of corridors, flames are less likely to spread rapidly because there is usually no or only a small amount of combustibles in these areas. The fire rooms in the real-scale fire experiments were configured in a pre-flashover state because the temperature or smoke caused by the flames from fire rooms is a major risk factor in corridors. An L-type corridor compartment for one-way evacuation and a T-type corridor compartment for two-way evacuation were fabricated in the size of 2.4(L) × 10(W) × 2.4(H) m to analyze the fire spread characteristics.
The average maximum temperatures measured in the L- and T-type corridors were 432.1 ℃ and 103.5 ℃, respectively, and it took 12.9 and 4.3 minutes to reach these temperatures, respectively. Fire models were presented by corridor type by applying the experiment results and ventilation characteristics to BFD curve. Although this study has limitations in presenting optimal fire models based on the study results due to limits in applying various factors and repeating the fire experiments, the purpose was to configure fire models based on the data measured through the real-scale fire experiments.
Protection measures for fire rooms are important to prepare for fire accidents in buildings, but preventing and coping with the outbreak of flames and smoke in the corridors is also a key factor for occupant safety. The corridors in buildings are usually used as evacuation routes, so those who fail to evacuate in the early stage may not secure adequate time and passage for evacuation due to exposure to flames and smoke. In corridors, the spread of flames has a greater effect than the expansion caused by combustibles, so it is necessary to establish appropriate evacuation measures by considering the ventilation characteristics of corridors in buildings.
Acknowledgment
This work was supported by the “Development of fire risk assessment technologies reflecting the fire vulnerability of (21 major) buildings” project funded by the Korean Institute of Civil Engineering and Building Technology.