


1. Introduction
The supply of freshwater resources is an important issue worldwide and for both developed and developing countries, and it is addressed in policies and laws for efficient management (Veiga and Magrini, 2013). Prior to the 1970s, Korea’s water environmental policy was a basic water quality policy that focused on acquisition of drinking water, sanitation, and wastewater treatment (Han and Choi, 2009). When water pollution problems such as heavy metal pollution (1989), phenol contamination (1991), and tap water odor problems (1994) were raised socially, the government proposed subsequent temporary measures. However, such temporary policies were often lost due to sharp opposition among local residents and had many obstacles that could not be overcome until they were implemented properly. Although the level and intensity of these policies was strengthened steadily, their effect on water quality improvement was not much better (Kim, 2006). Therefore, the Korean Ministry of Environment attempted to establish measures for water management by using watershed modeling to provide preventive measures instead of the conventional method. From the end of the 1990s to 2005, this policy was set up as a major national agenda, a comprehensive water management plan for improvement of the water quality and a clean water supply for the four major rivers of Korea, the Han, Nakdong, Geum, and Yeongsan (ME, 1999). However, this policy was limited to water quality management based only on the water supply source, so water quality improvement and ecosystem restoration effects did not materialize as expected. Other problems with the policy were that the range of target watersheds was too large and no specific goal was established. For these reasons, it was difficult to identify the causes of pollution and verify water quality improvement effects (Song et al., 2009). To solve these problems, <The 1st Water Environment Management Master Plan>, a national policy for a period 10 years (2006–2015) designed to improve the water environment of the entire country including its rivers, small streams, lakes, and coastal areas, was established (ME, 2006). The goal of the policy, as the highest priority government plan of the water environment and aquatic ecosystem, was “Clean Water, Eco River 2015.” The plan guided water quality conservation plans by the environmental offices and local governments of each river basin and strengthened water environment management (Lee, 2006).
The watershed can be divided into a distinct river, stream network, or sub-watershed (Chen et al., 2014). Based on the Water Quality Conservation Act, the policy stipulated that water quality should be classified according to four major basins (the Han, Nakdong, Geum and Yeongsan River), 117 mid-level basins, and 840 unit basins in Korea (Table 1).
The assessment of water quality is based on biochemical oxygen demand (BOD) and total phosphorus (T-P) for rivers and streams and on chemical oxygen demand (COD) and T-P for lakes, in accordance with the Total Maximum Daily Loads (TDML) of Water Quality and Aquatic Ecosystem Conservation Act (ME, 2008). As shown in Table 2, water quality is categorized into seven grades (very good, good, fairly good, fair, fairly poor, poor, and very poor). In addition, water quality of grade Ⅱ (fairly good) or higher is classified as “good water.” Target water quality grades were established for each mid-level basin in consideration of water quality measurement data acquired before 2006. These targets were established as based on the <Riverine Development Plans>, <Watershed Environment Change plans>, and <Basic Environmental Treatment Facility Installation Plans>.
In this study, an evaluation of the achievement of target water quality standards and the target of “Good water” was carried out according to <The 1st Water Environment Management Master Plan> in the Nakdong River Basin, which includes the Busan city. In addition, this study evaluated the cause of mid-level basins not achieving the target and the problem of a water quality monitoring representative point of each mid-level basin. Furthermore, based on this study, additional studies for improvement of the water environment were suggested. This paper is intended to be used as a tool for revising <The 2nd Water Environment Management Master Plan>, which was previously established in 2016, through the comprehensive understanding of the status of river water quality provided within it.
2. Methodology
Based on <The 1st Water Environment Management Master Plan>, the target water quality standards of each mid-level basin in the Nakdong River Basin were established. The target water quality standards were set by applying the ‘QUALKO’ model, which is modified from the ‘Qual’ model developed by Masch et al. (1971), to the Korean river basin (Han et al., 2008). The total watershed is divided into n sections, and the interior of each section is divided by the headwater element, standard element, element just upstream from a junction, junction element, last element stream, input element, and withdrawal element. Finally, the target water quality is calculated for each small section.
The achievement period was set at 10 years, the plan period, and the achievement was analyzed based on the annual average water quality of BOD and T-P in 2015. The water quality evaluation methods in Korea are the annual average water quality method (Eq. 1) and the past 3 years’ average water quality method (Eq. 4) (ME, 2010). The procedure based on the annual average water quality method calculates the annual arithmetic average using the measured water quality (MQ) data for ‘n’ times at each water quality analysis point. The procedure based on the past three years’ average water quality method calculates the water quality using the converted average water quality (CAQ) and the conversion variance (CV); however, it has the limitation that it cannot represent the water quality of a specific year. It also could not be applied to obtaining reasonable average T-P value. For this reason, the annual average water quality method was used in this study. In addition, the rationality of the BOD was analyzed by comparing between the ‘Annual average water quality’ and ‘Past 3 years’ average water quality’.
Annual average water quality method
Past 3 years’ average water quality method
To assess achievement of the target water quality, if one of the item’s BOD and T-P did not attain the target water quality, the basin was designated as a non-achieving area. In addition, the achievement of ‘good water’ quality was assessed separately from the achievement of target water quality. In addition, water quality improvement rate was analyzed by following equation:
Cause identification for non-achieving basins was conducted by analyzing the basin status, such as the basin’s region, location condition, pollution sources, weather, and stream status. Water quality, weather, and streams information was collected from the Water Resources Management Information System (MOLIT, 2016), and an analysis of the water quality pattern by weather and tributaries was conducted in each basin. Pollution source information was collected from the Nationwide Water Pollutant Source Survey (ME, 2015b), and these data were compared with the forecast values for 2015 that were predicted at the time of <The 1st Water Environment Management Master Plan>. In addition, water quality monitoring representative points where there was a problem of water quality were evaluated for appropriateness of the target water quality standard and alternative points were sometimes suggested. The water quality monitoring representative point in each basin should be able to reflect the characteristics of the basin needed to understand the tendency of water quality change and to identify the achievement of the target water quality for each basin proposed in the <Water Quality Monitoring Program> (ME, 2015c). For these reasons, the water quality monitoring representative point in each basin is commonly located at the downstream end of a river or stream that represents the basin, in the downstream region of the dam, or, in the case of other watersheds, at the largest unit basin area or longest river extension.
3. Results and discussion
3.1 Assessment of <The 1st Water Environment Management Master Plan> in the Nakdong River Basin
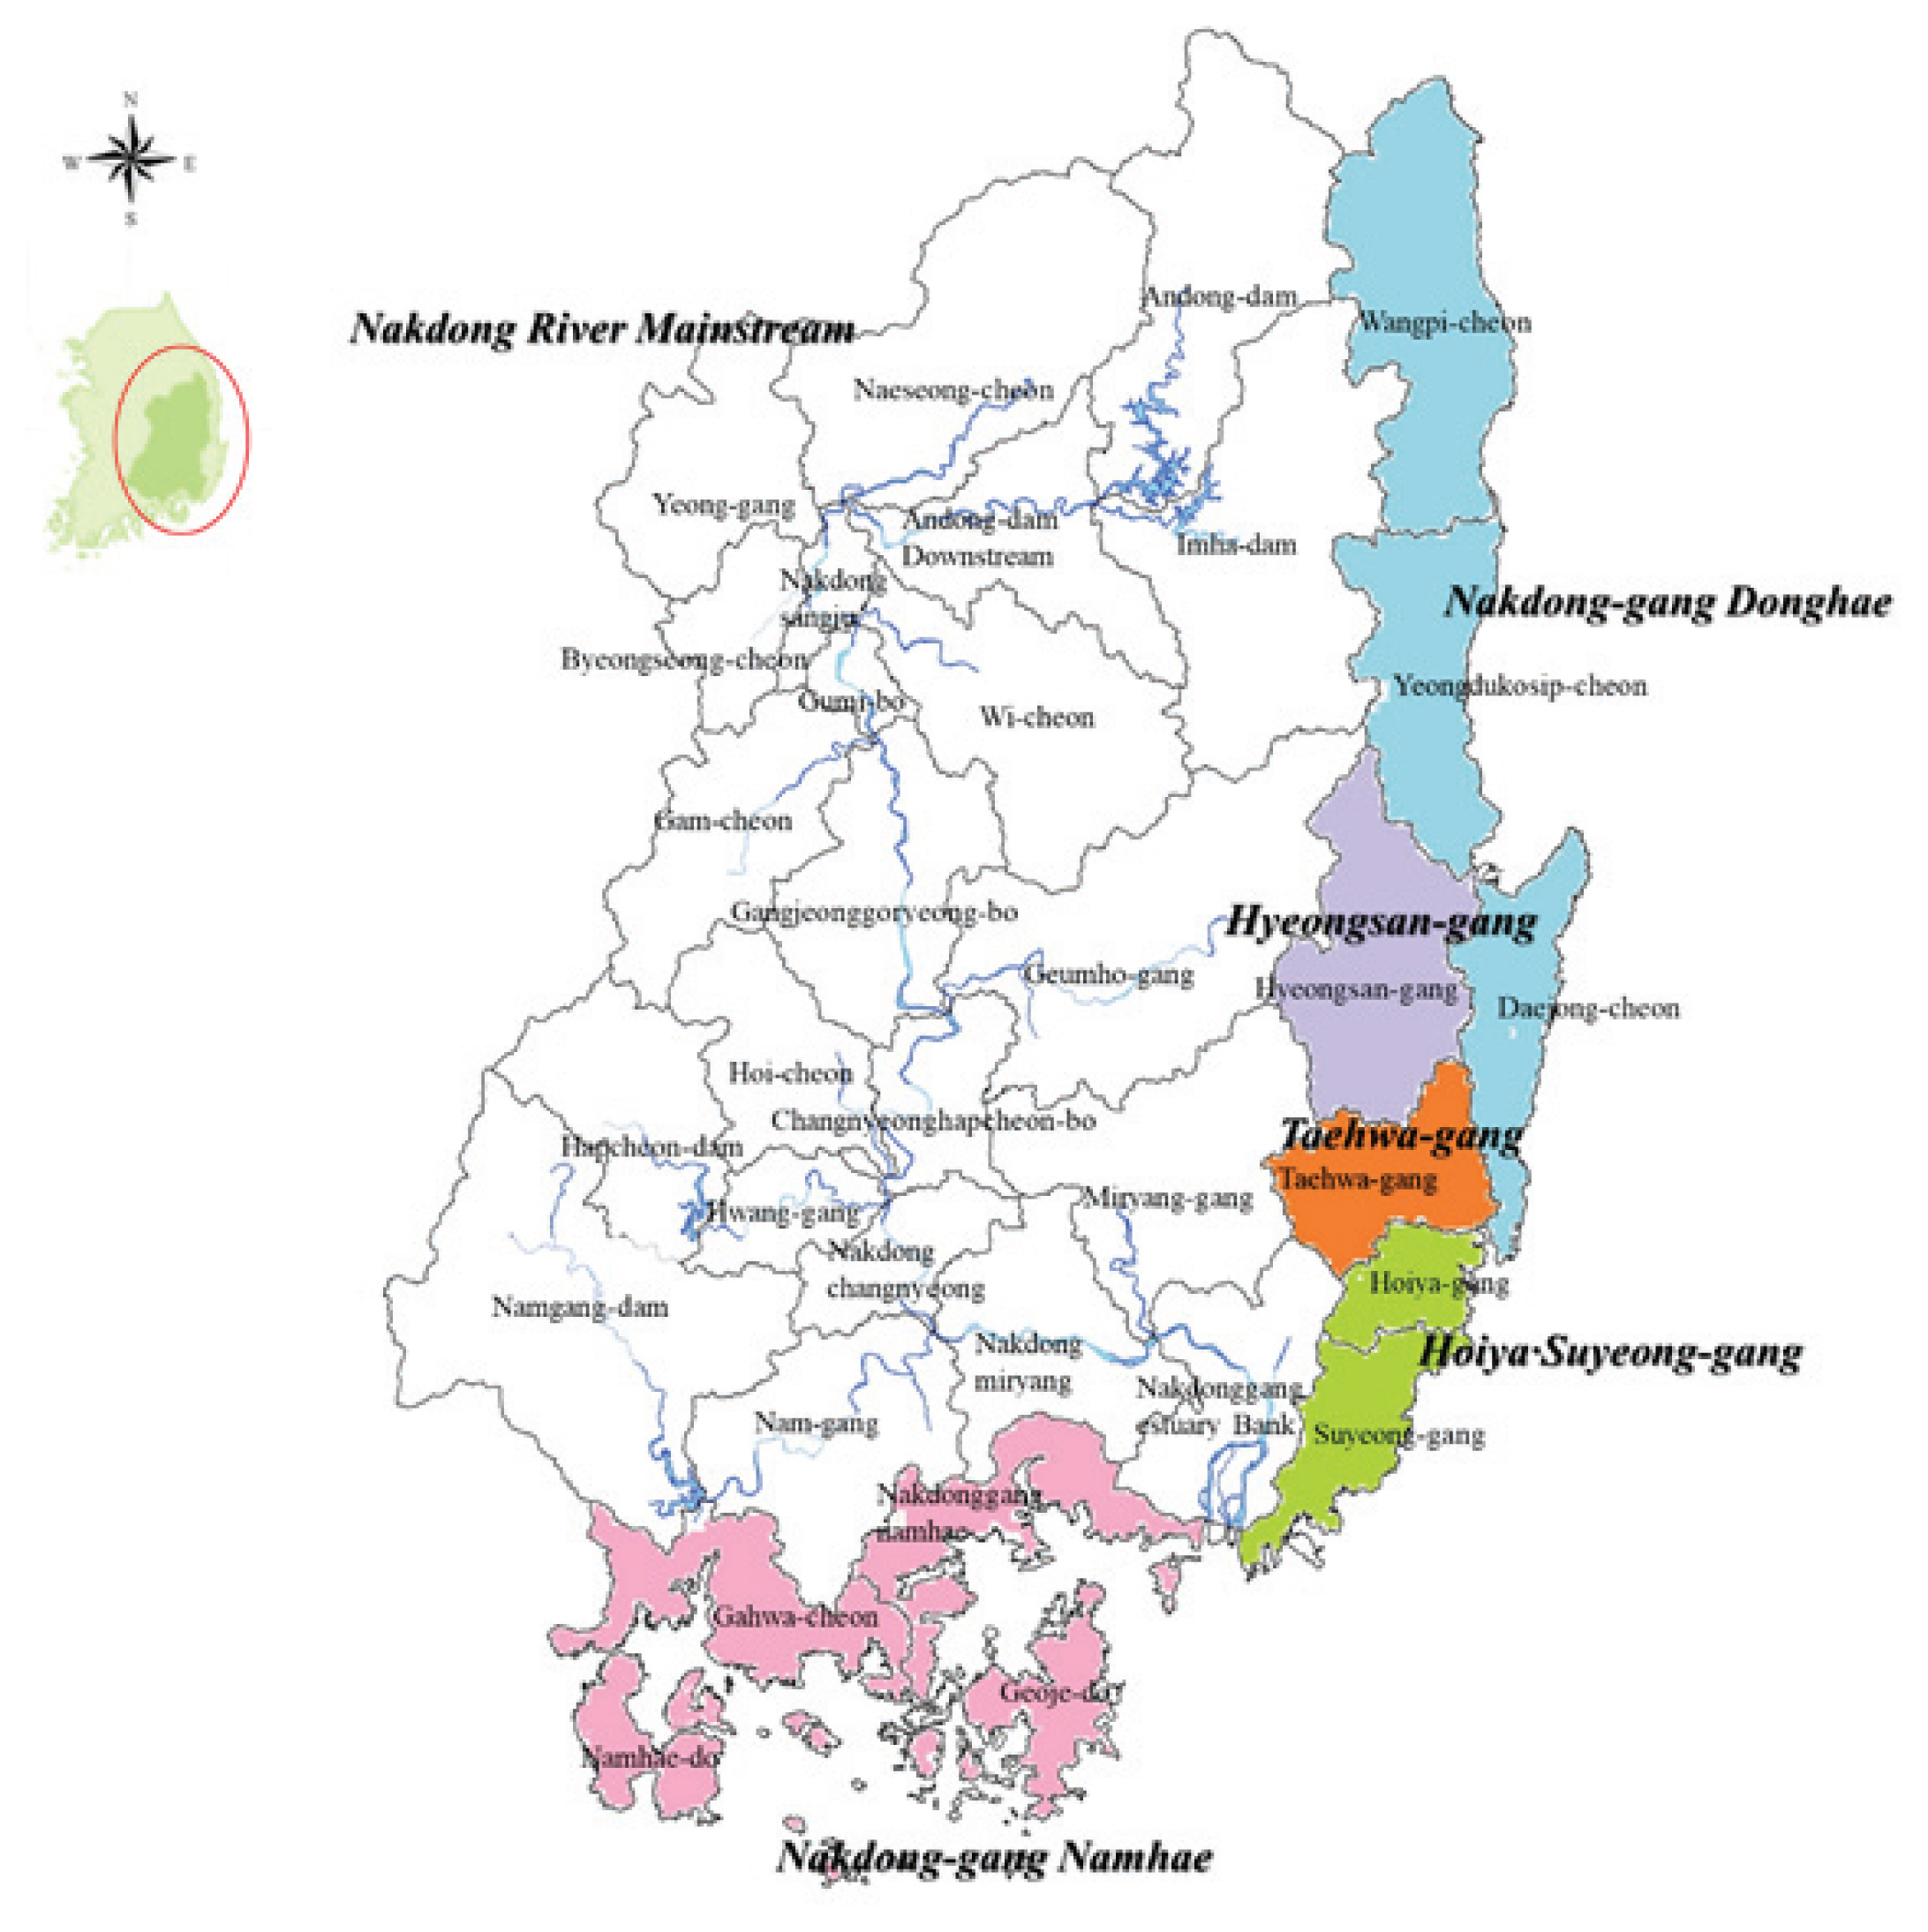
The Nakdong River, the longest river in South Korea (525 km long), originates in Taebaek, Gangwon Province, and flows through Gyeongsangbuk Province, the Daegu Metropolitan City, Gyeongsangnam Province, and the Busan Metropolitan City. The Nakdong River Basin includes 33 mid-level basins (Fig. 1; 22 basins on the Nakdong River mainstream watershed and 11 basins in other watersheds: Nakdong-gang Donghae, Nakdong-gang Namhae, Hyeongsan-gang, Taehwa-gang and Hoiya∙Suyeong-gang) and 266 unit basins. Table 3 shows the status of the Nakdong River Basin and its water quality monitoring representative points.
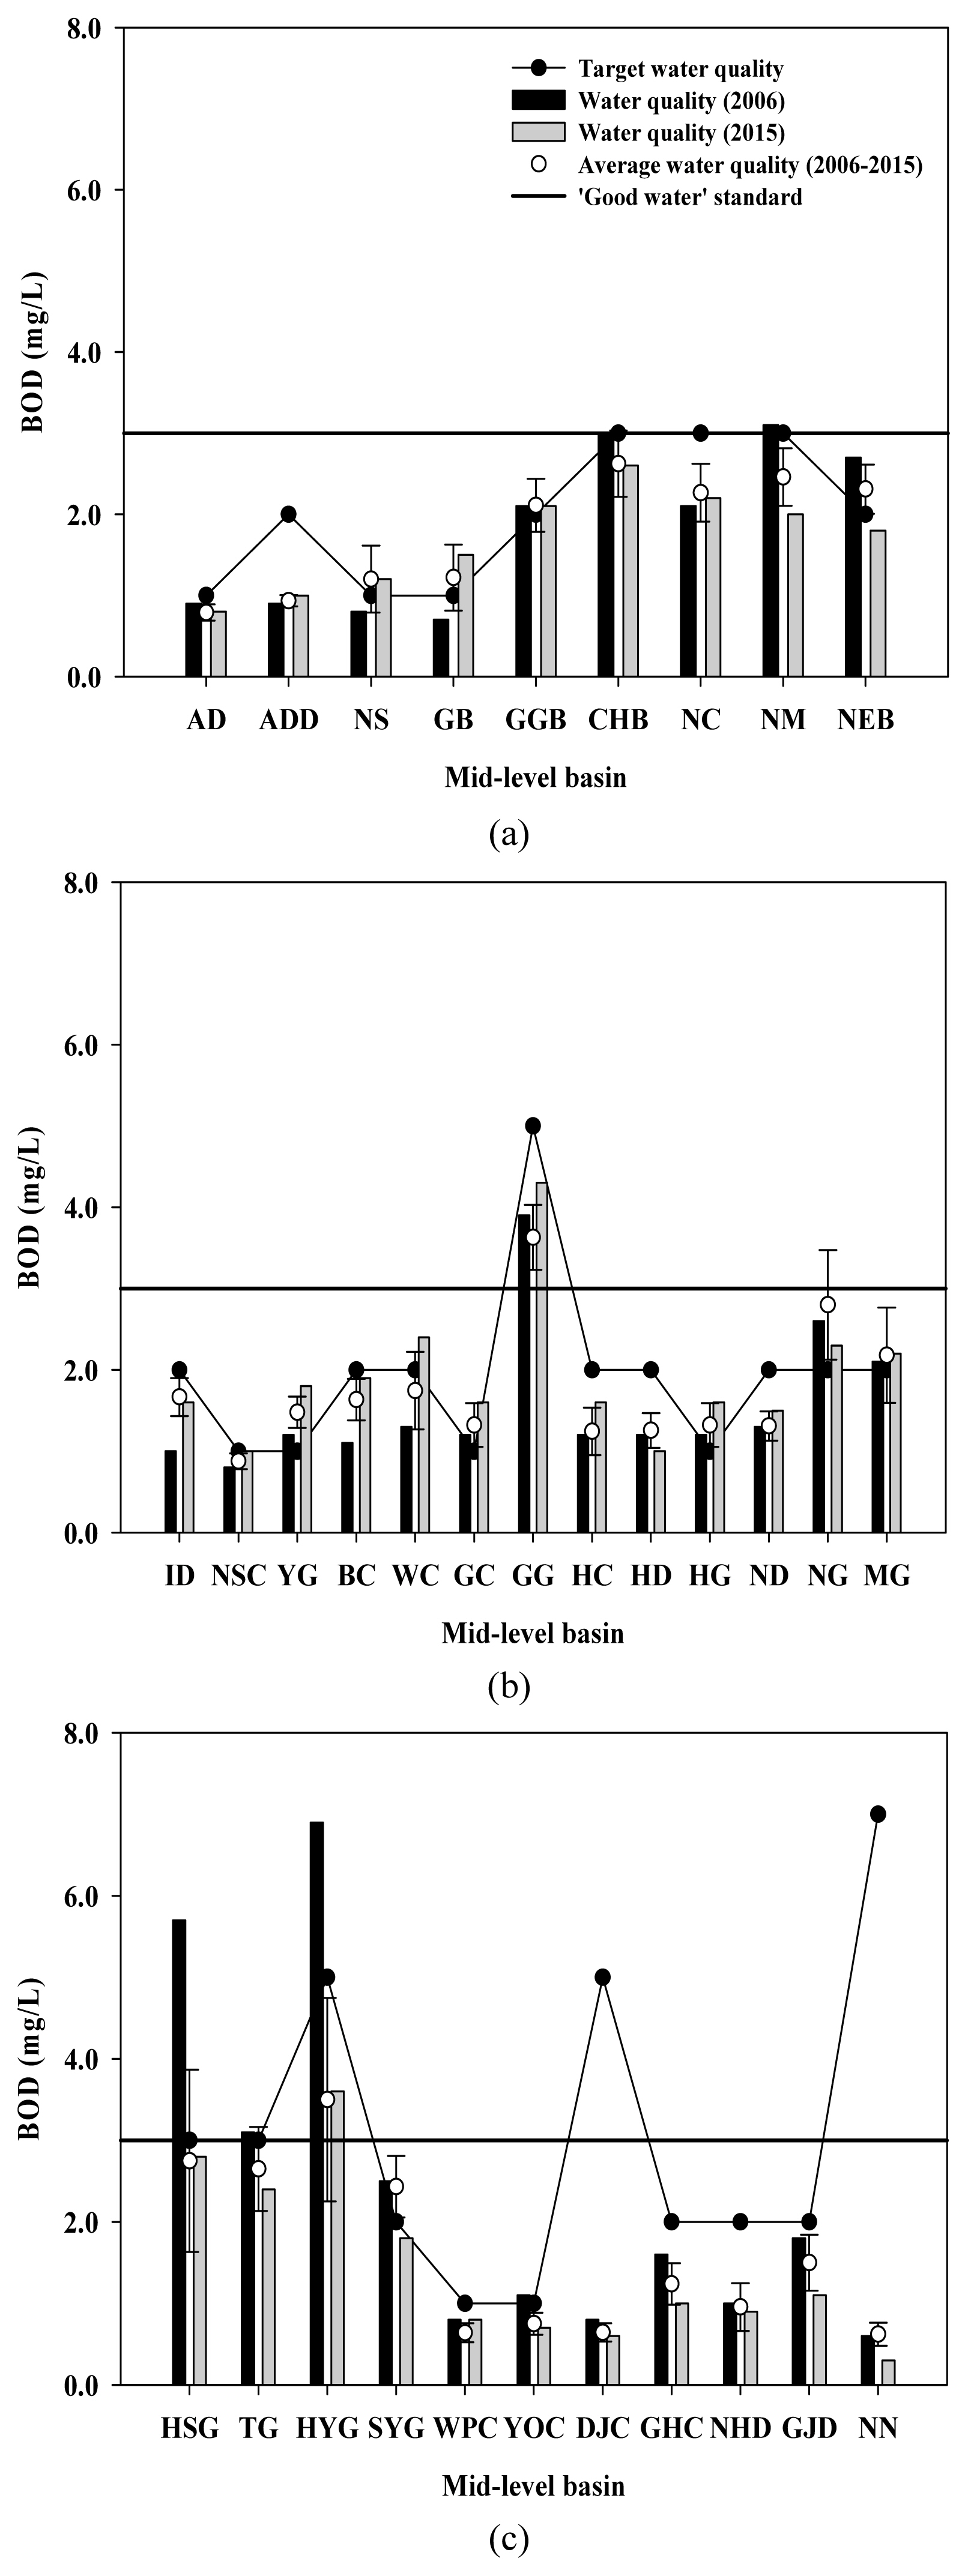
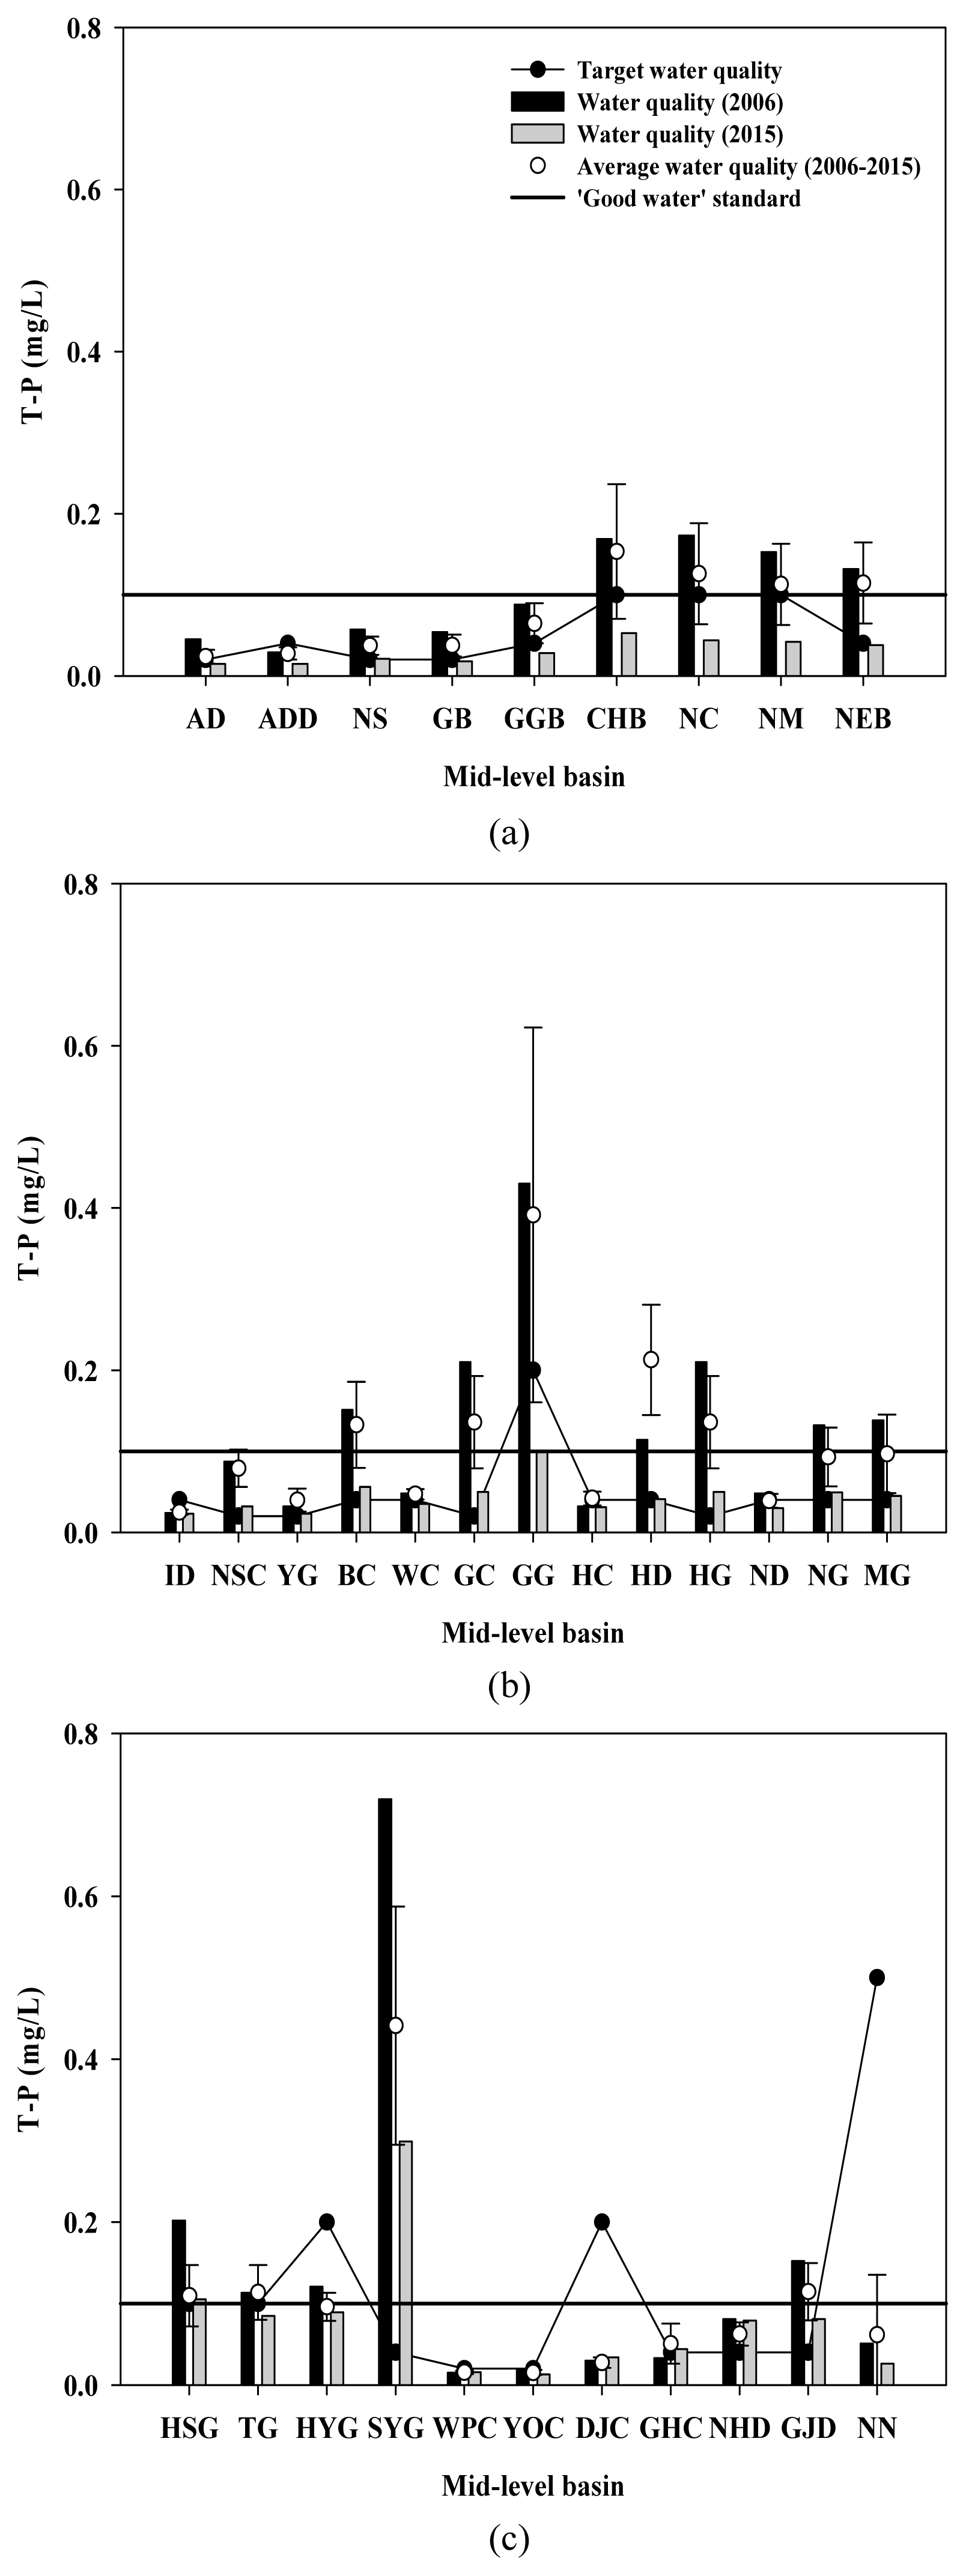
The achievement of the target water quality established for each mid-level basin is expressed as the average annual water quality in 2015 at the water quality monitoring representative point. Fig. 2 and Fig. 3 shows the water quality in terms of BOD and T-P in 2006, 2015 and the average water quality from 2006 to 2015 for each basin determined by the annual average water quality method and also shows the target water quality and the ‘good water’ standard. The BOD water quality was deteriorated in some mid-level basins among the mainstream (Fig. 2(a)) and tributaries (Fig. 2(b)) of the Nakdong River compared to 2006, however, most of the other watershed were improved. Contrary to BOD water quality, T-P water quality improved in the entire Nakdong river mainstream (Fig. 3(a) and 3(b)). Table 4 shows the target water quality grade, the water quality in 2015 based on both the annual average water quality and the past 3 years’ average water quality, and whether each mid-level basin achieved the targets and ‘Good water’ based on the annual average water quality in 2015. In the Nakdong River Basin, 25 and 31 mid-level basins achieved the BOD target water quality and the “Good water”, for achievement rates of 75.8 and 93.9%, respectively. In addition, 19 and 31 mid-level basins achieved the T-P target water quality and the “Good water”, for achievement rates of 57.6 and 93.9%, respectively. The Geumho-gang Basin and Hoiya-gang Basin did not achieve the BOD “Good water” standard and the Hyeongsan-gang Basin and Suyeong-gang Basin did not achieve the T-P “Good water” standard. Accordance with the past 3 years’ average water quality, the Naeseong-cheon, Nakdonggang estuary bank and Suyeong-gang were not achieved the target water quality. At some mid-level basins, the BOD water quality differed between the annual average water quality and the past 3 years’ average water quality, but they were generally similar with a difference of approximately 0.3±0.06 between the methods.
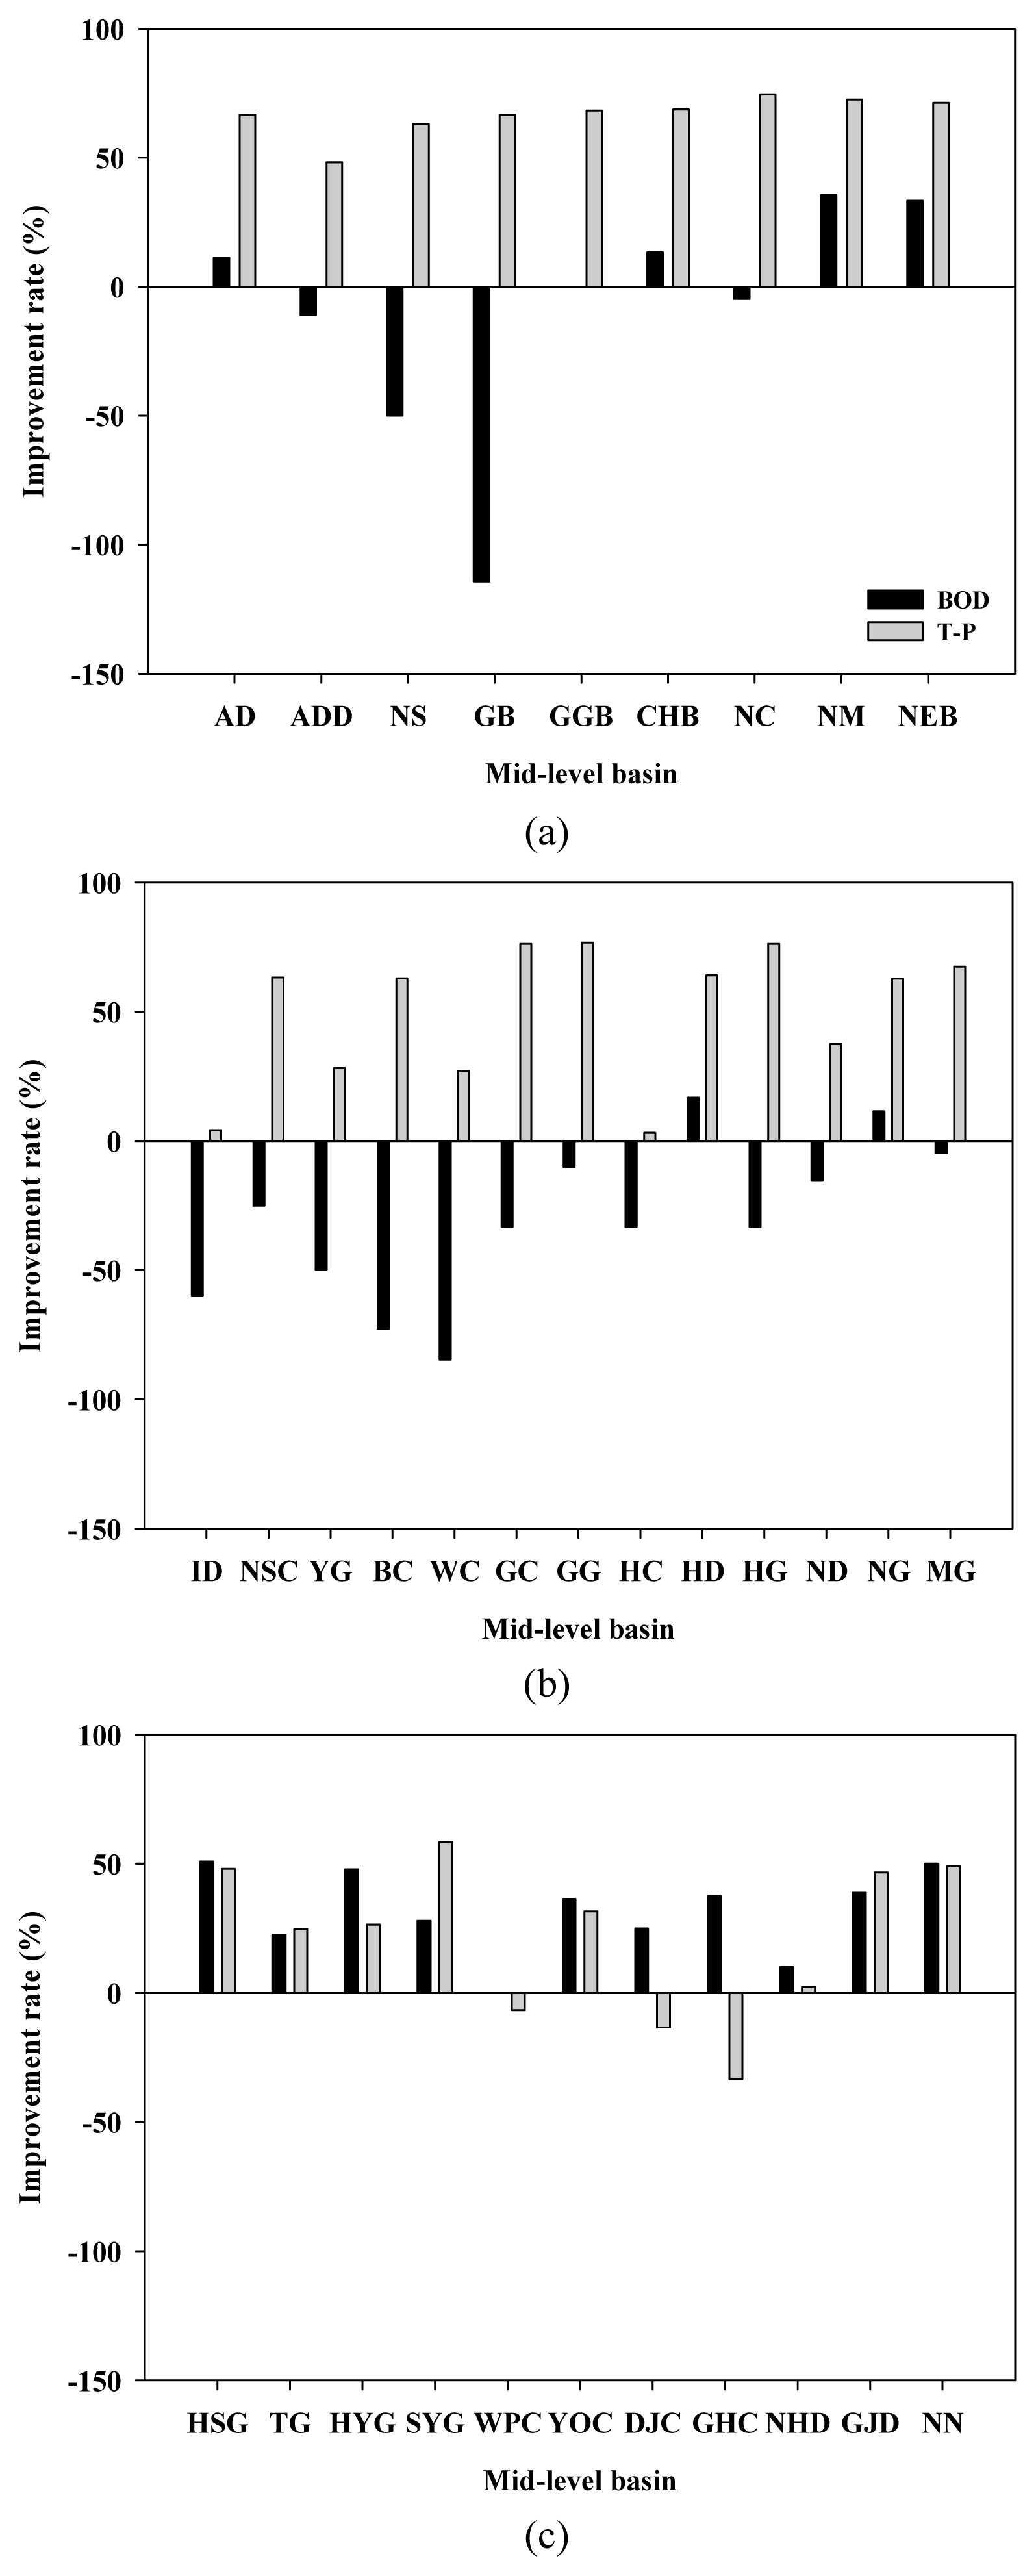
16 of the 33 mid-level basins in the Nakdong River Basin achieved the targets for both BOD and T-P, accounting for 48.5% of the mid-level basins. Among the mid-level basins, 15 basins excluding the Hyeongsang-gang and Gahwa-cheon basins did not achieve the target water quality continuously from the time when the plan was established (data is not shown). Fig. 4 shows the mid-level basins where the target water quality was not achieved. The non-achievement rate of the 33 mid-level basins is 51.5%; however, when calculated as an area ratio, only 40.3%, corresponding to 13,480 km2 of the total area of the Nakdong River Basin of 33,372 km2 was non-achieving. Nevertheless, irrespective of the target water quality standard, the achievement ratio of “Goodwater” was 87.9%, and only the Geumho-gang, Hyeongsan-gang, Hoiya-gang, and Suyeong-gang were non-achieving mid-level basins. Fig. 5 shows the improvement of BOD and T-P water quality in 2015 compared with 2006. In contrast to the deterioration of BOD quality in the middlestream of Nakdong river (Fig. 5(a)) and tributaries (Fig. 5(b)), T-P was greatly improved. In the other watershed (Fig. 5(c)), the improvement was mostly improved except for some T-P deterioration in several mid-level basins.
One of the reason for the low achievement is the incorrectly predicting of the pollutant load in 2015, not only at the plan establishment in 2006 but even at the plan revision. Therefore, there were errors in setting the management priority according the pollution load. Along the mainstream of the Nakdong River, the distribution of main pollutant sources is different in upstream, middle, and downstream portions. The upstream portion of the Nakdong River, which has a relatively large rural area, is affected by nonpoint pollution sources, such as agricultural and livestock wastes. The pollution of rivers by such nonpoint sources of pollution is a big problem throughout the world (Zhang et al., 2016), and the U.S. Environmental Protection Agency has stated that nonpoint source pollution is one of the major causes of river water deterioration (Brown and Froemke, 2012). In particular, the T-P concentration in the upper stream of the Nakdong River tended to be high in July and August, the rainy season in Korea. On the other hand, in the middle and downstream reaches of the river, there are densely populated areas and large industrial complexes and the influences of point sources of pollution such as residential and industrial wastes are conspicuous. In the case of Busan City, the Mulgeum area of the Nakdong River is used as a source of drinking water, and the industrial wastewater discharged from industrial complexes near the Daegu City and Gyeongsangbuk Province into the Nakdong River flows into the Mulgeum area causing a conflict between Busan and Daegu.
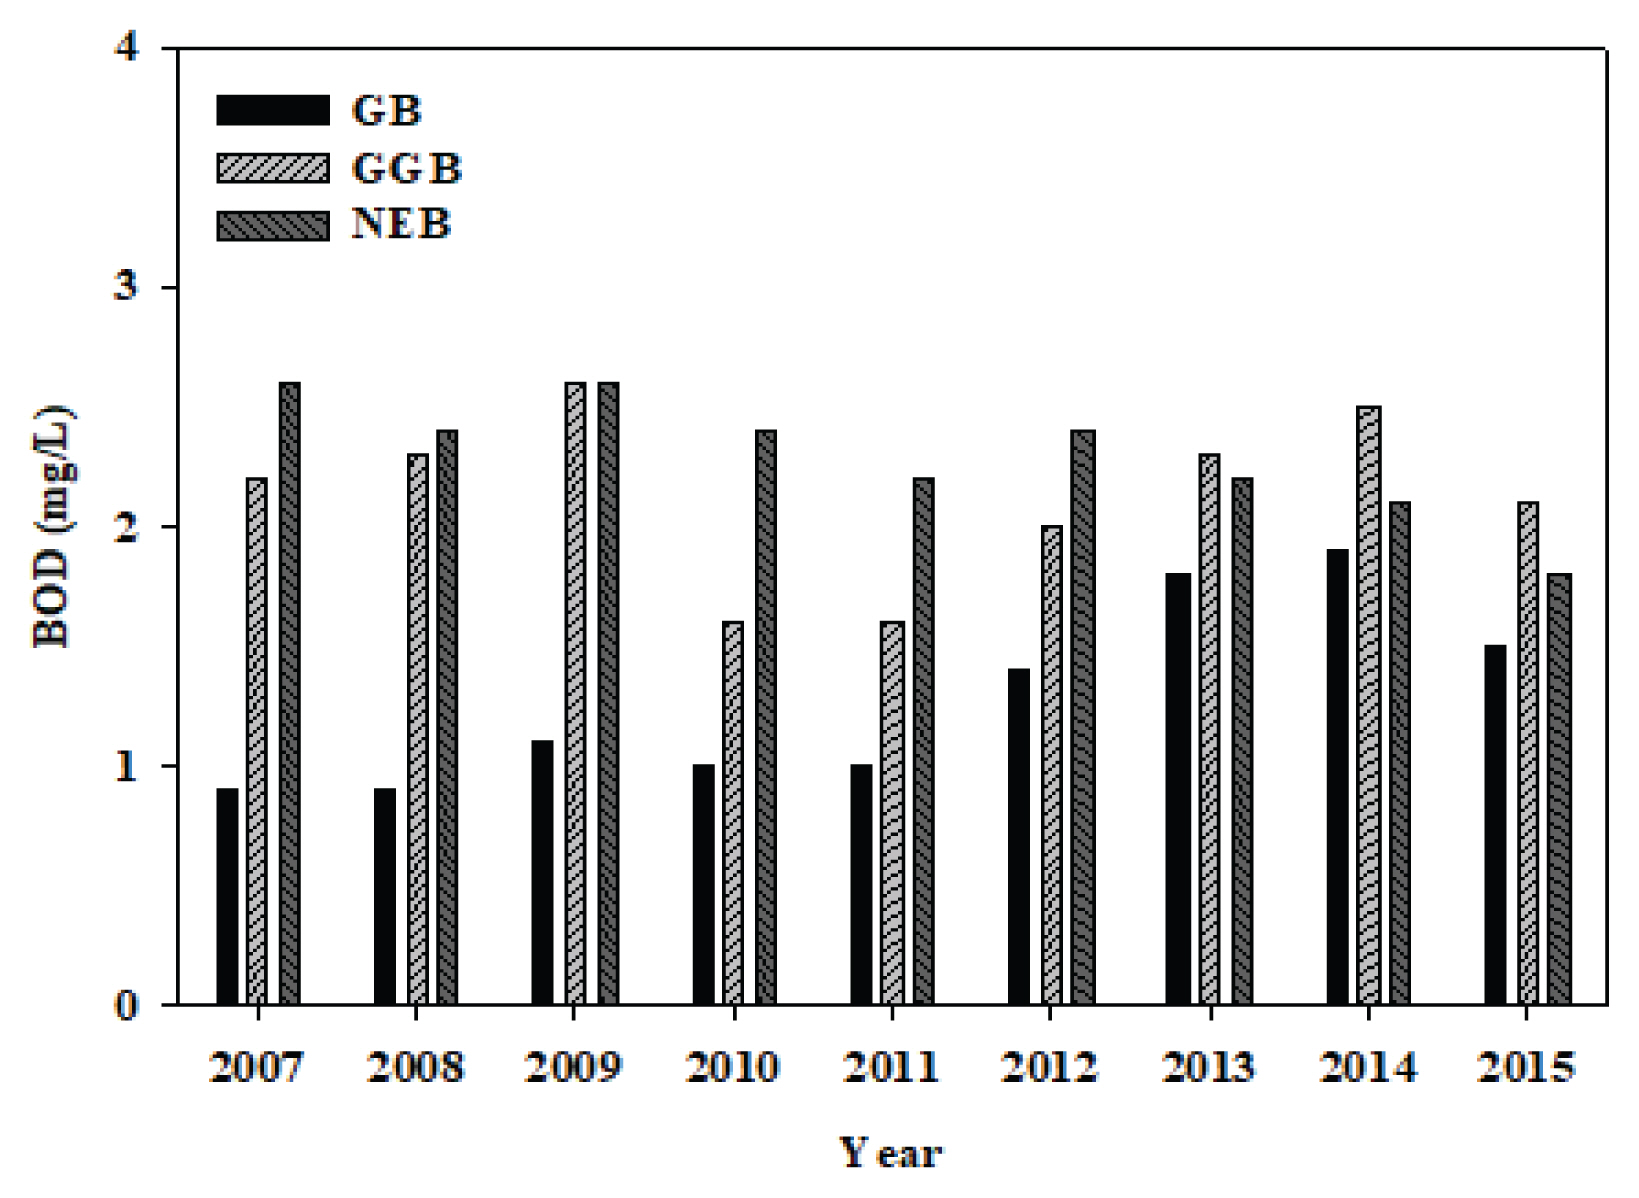
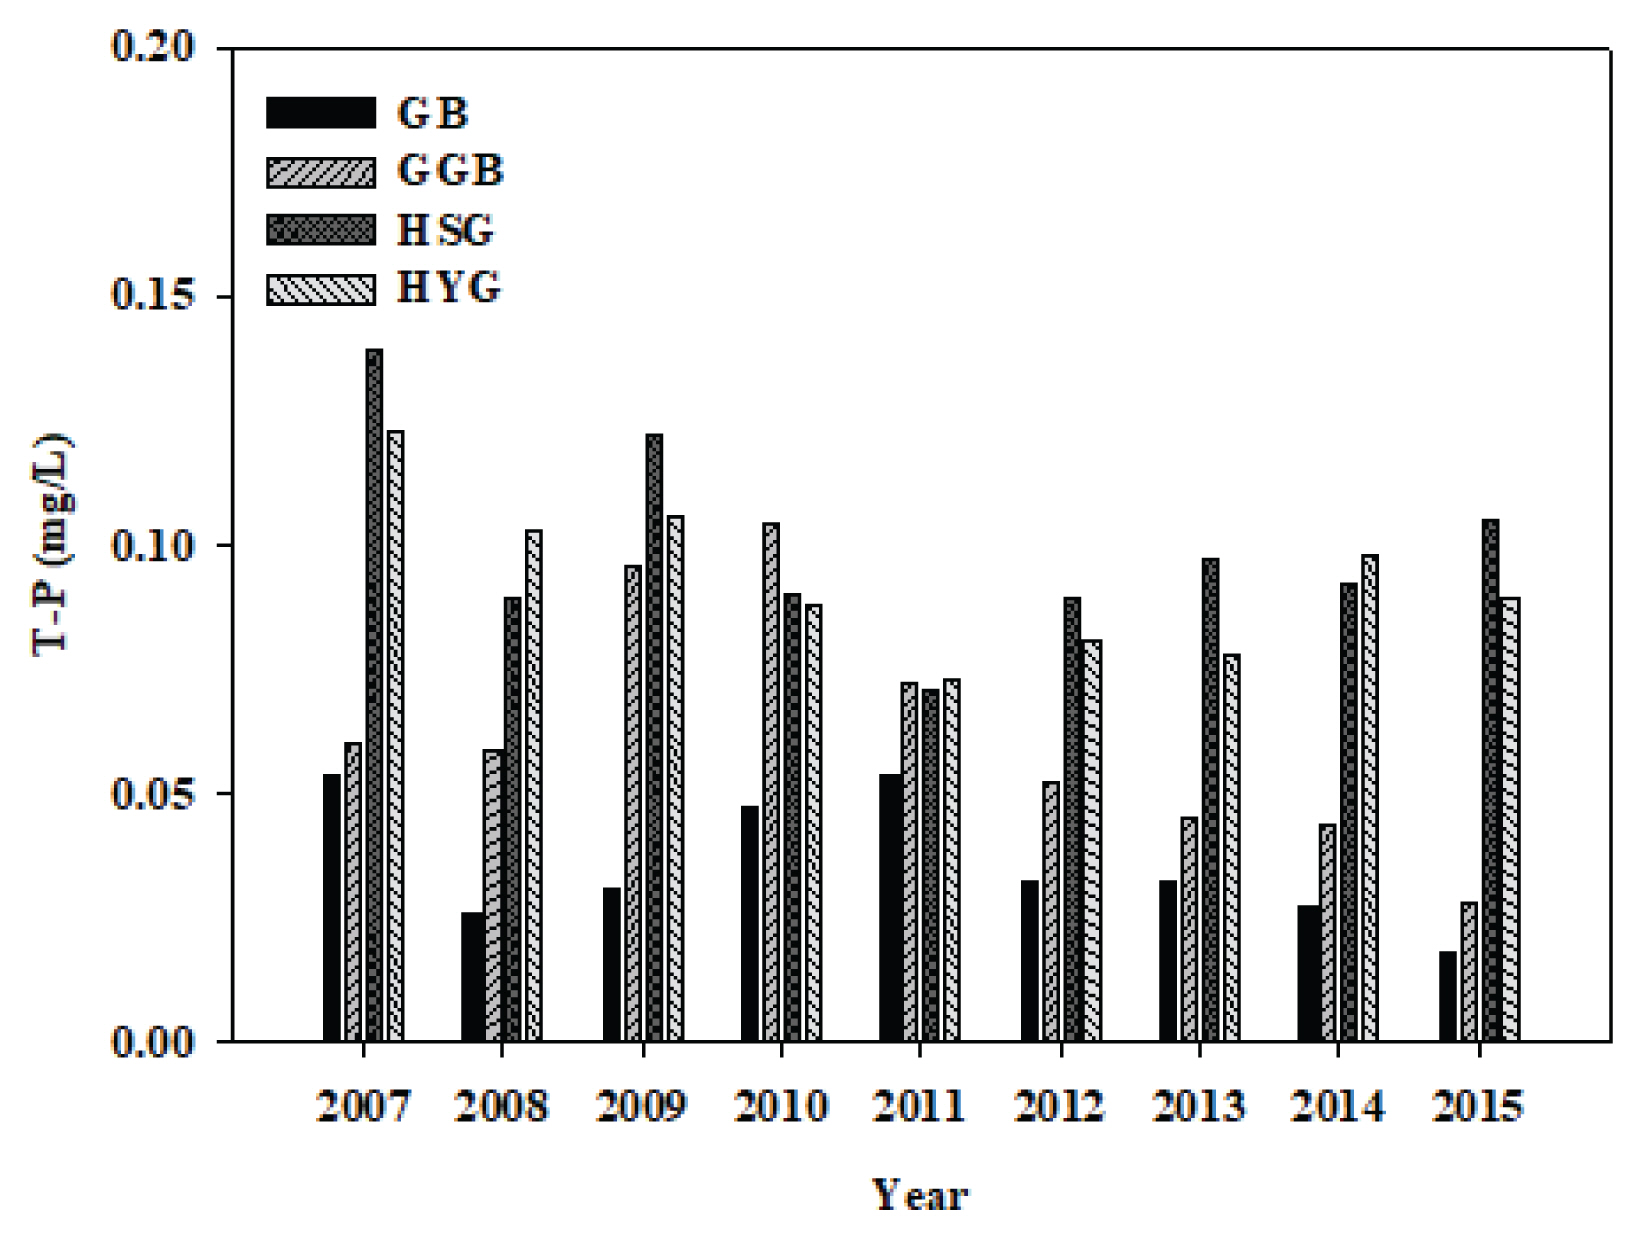
In Korea, from 2009 to 2011, the Four Major River Restoration Project was carried out as a part of the National River Maintenance and Restoration Project. As a result, 16 multi-purpose weirs (called ‘bo’ in Korean) were installed on the four major rivers in Korea, and the river environments, such as their flow regime, was changed accordingly. In the case of the Nakdong River, it was shown that the flow rate decreases from the upstream to the downstream portion due to the linkage of weirs and dams (Ahn et al., 2014). The BOD concentrations at Gumi-bo and Gangjeonggoryeong-bo in the Nakdong River mainstream tended to increase after the Four Major River Restoration Project. Due to the construction of the weirs, the flow of the middle stream portion of the Nakdong River stagnated, which led to a reduction in DO that resulted in an increase in BOD (Lee et al., 2014; Parveen and Singh, 2016). Contrarily, it was also found that middle stream pollutants could not move to the downstream area due to the weirs and that the water quality of the downstream region had improved to the target water quality standard (Fig. 6). Furthermore, as one of the enactments of this project, the discharge standard for T-P was strengthened, and it became obligatory to install a T-P treatment facility at wastewater treatment plants discharging water to the four major rivers of Korea (Seo et al., 2016). Especially, at Gumi-bo and Gangjeonggoryeong-bo, along the Nakdong River mainstream, T-P has improved since 2012, when the project was completed. However, in other watersheds not included in the watersheds of the four major rivers, where installation of a T-P treatment facility is not mandatory, such as Hyeongsan-gang and Hoiya∙Suyeong-gang, the treatment of T-P was insufficient and effluent from wastewater treatment plants affected the water quality of the mid-level basin. Indeed, in non-achieving basins in these other watersheds, the target water quality standard for BOD was achieved but the target for T-P was not achieved (Fig. 7).
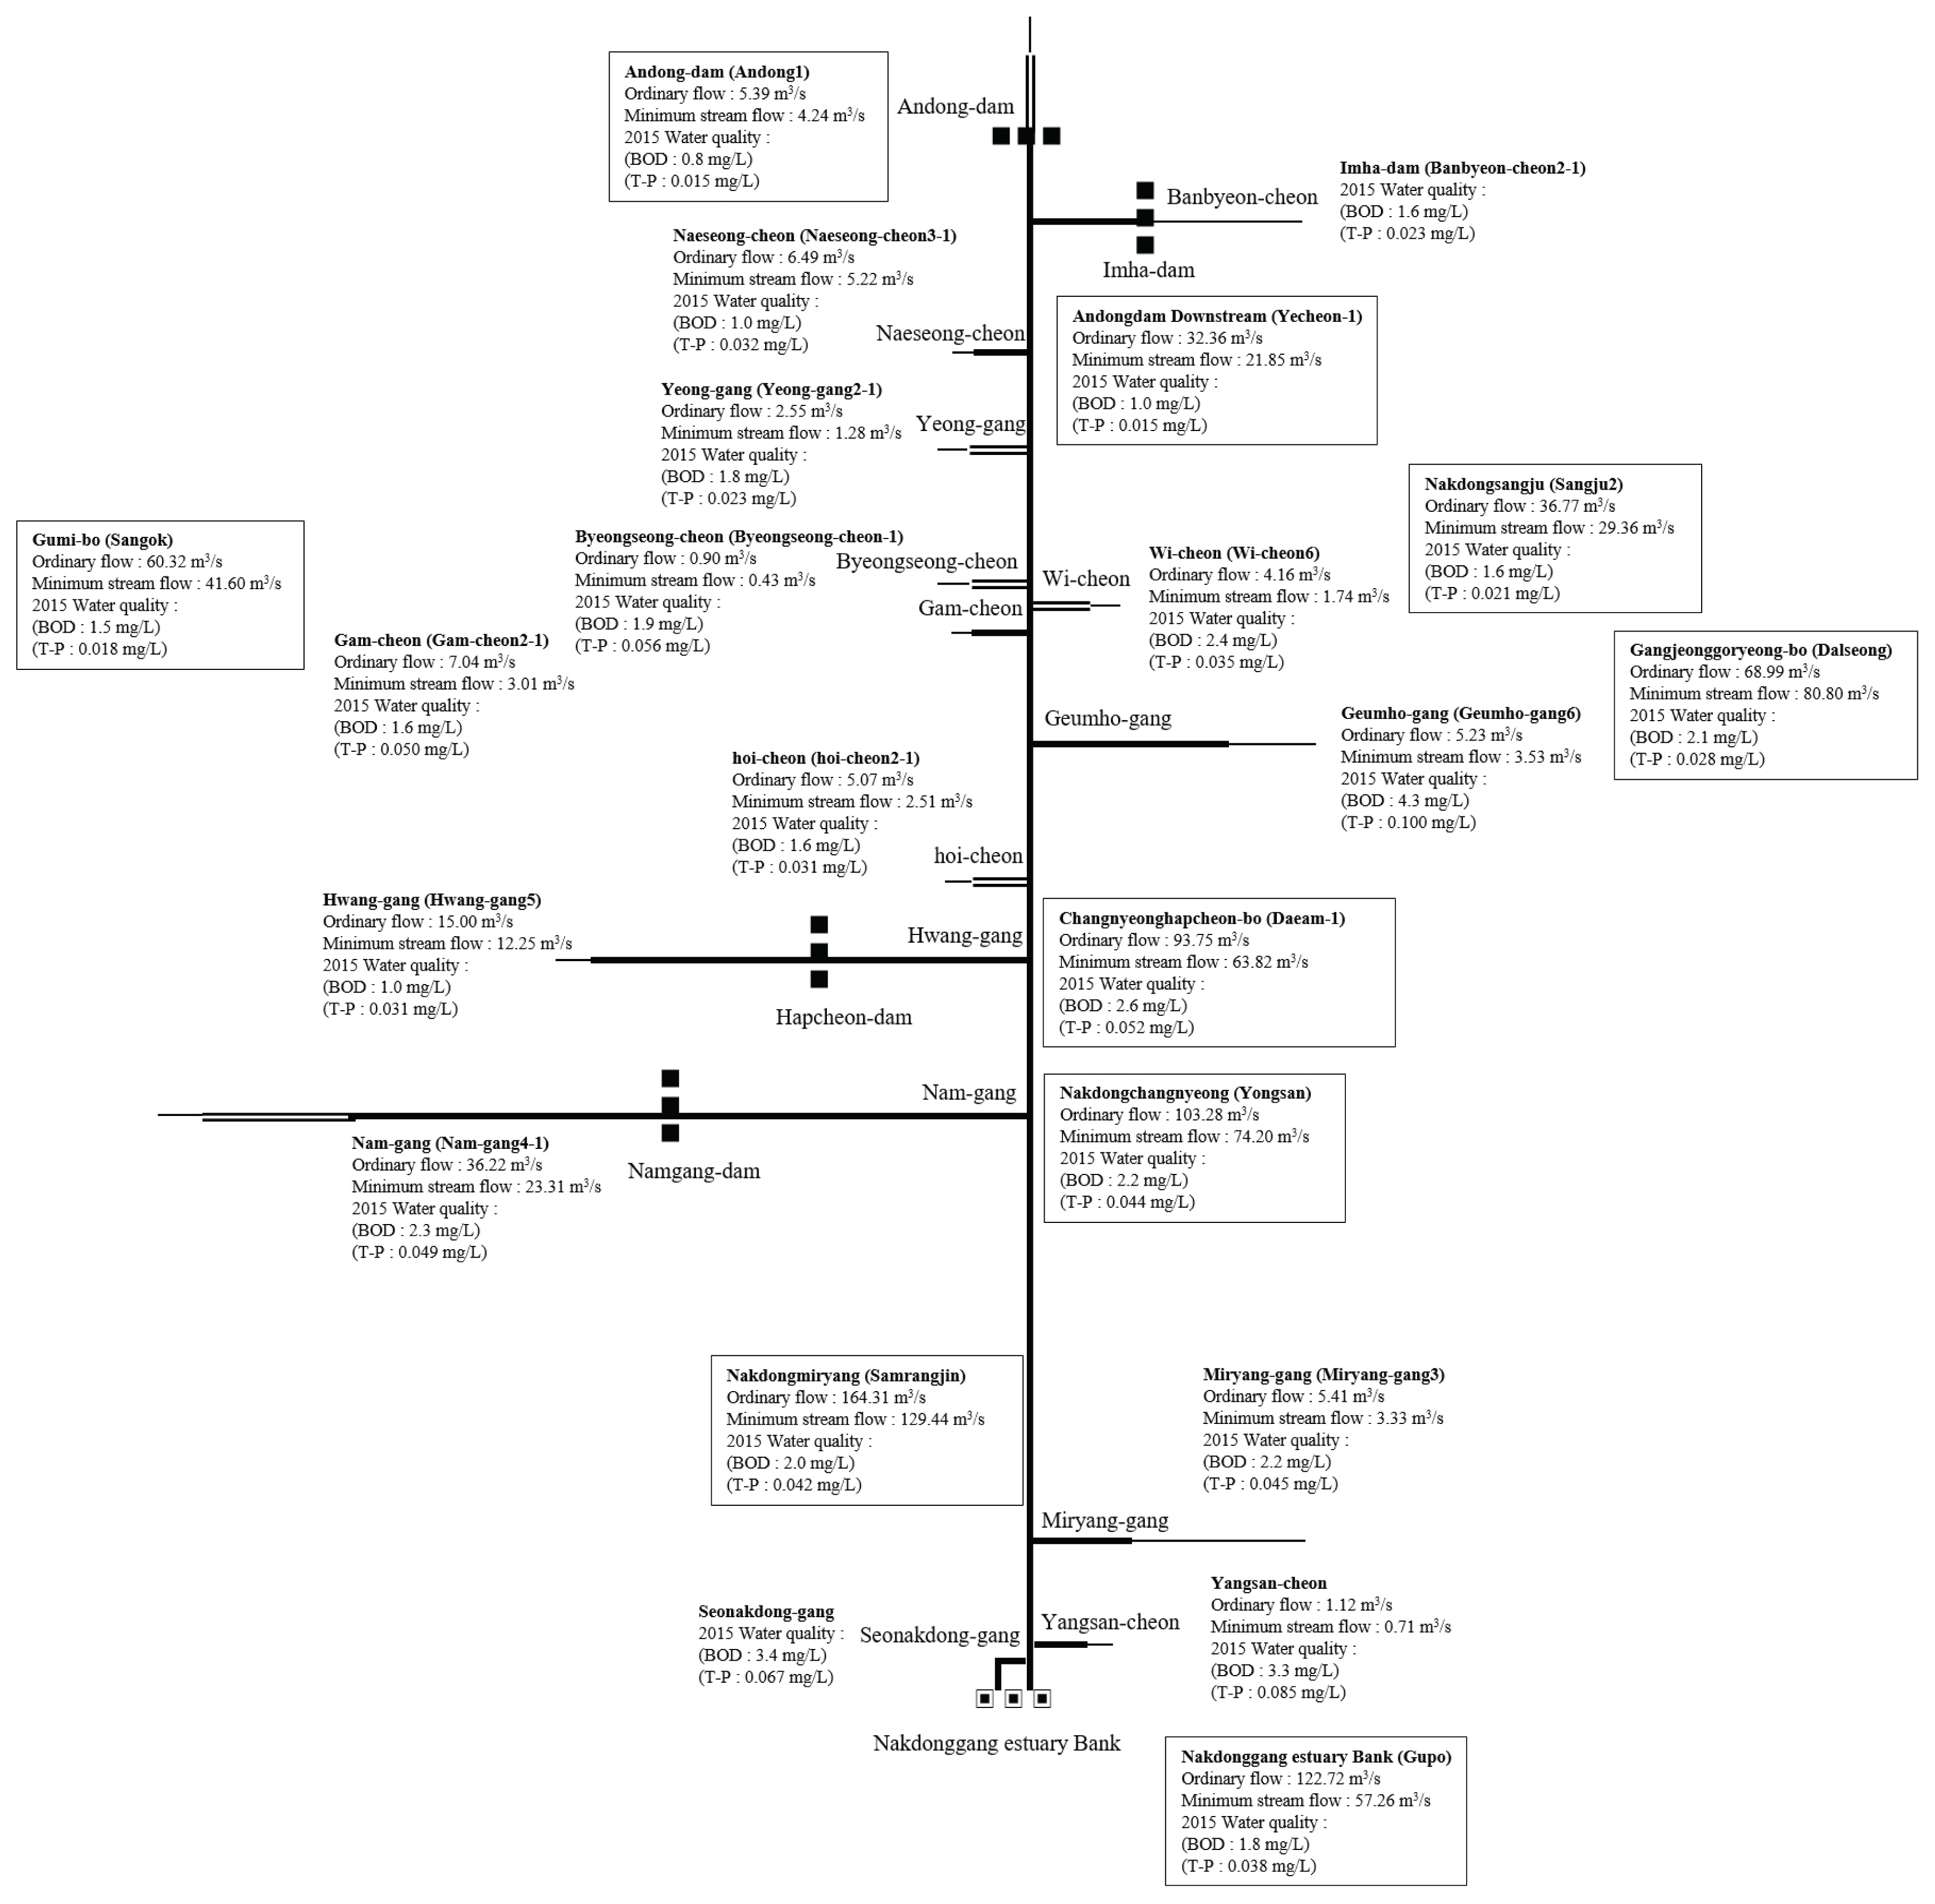
In addition, the effluent of tributaries can affect the water quality of the mainstream (Li and Morioka, 1999). Fig. 8 shows a schematic diagram of major first-order tributaries of the Nakdong River mainstream that illustrates how the mainstream is influenced by the water quality and flow rate of the tributaries. High water pollution level or improved water quality in tributaries can affect the water quality of the mainstream (Sun et al., 2014; Chea et al., 2016). Among the first-order tributaries of the Nakdong River, Banbyeon-cheon and Geumho-gang in the upper stream and Seonakdong-gang in the lower stream are representative. As these tributaries join the mainstream of the Nakdong River, the flow rate and water quality of the river change. The flow regime of the stream is used to analyze the variability of its stream flow. It is classified into four categories: abundant flow (average flow maintained for 95 days, Q95), ordinary flow (average flow maintained for 185 days, Q185), low flow (average flow maintained for 275 days, Q275) and drought flow (average flow maintained for 355 days, Q355).
3.2 Problem of water quality monitoring representative points
Lee et al. (2012) stated that the water quality monitoring point could be located at the downstream of the watershed or stream section. However, some mid-level basins that do not have a mainstream area to represent the basin do not meet the criteria of a water quality monitoring representative point and require an alternative point. In these mid-level basins, it is reasonable to set the representative point of water quality monitoring for the largest unit basin or for the river or national river with the longest stream extension. From this point of view, the Gahwa-cheon and Namhae-do mid-level basins require a re-established representative point. At present, the water quality monitoring representative points of these two mid-level basins are Gonyang-cheon and Namhaebong-cheon, respectively, but these points are not expected to represent the water quality of these mid-level basins because the area of the unit basins in which the points are located is not the largest or the river extension is not the longest.
In addition, the water quality monitoring representative points of the Taehwa-gang and Suyeong-gang mid-level basins are in areas that are highly affected by seawater. The electrical conductivity values of these two areas are 18,900 and 31,200 μS/cm, respectively, which indicates that they are more affected by seawater than other basins. de Sousa et al. (2014) stated that the relationship between electrical conductivity and DO is inversely proportional. Their results showed that the concentration of organic matter to be treated in the high electrical conductivity areas is high and that DO is maintained at a low level.
In the downstream region of the Taehwa-gang mid-level basin, unusual green tides have sometimes occurred due to the formation of stagnant water in the downstream area and the deterioration of the basin’s self-purification ability due to the decrease of flow rate during the drought flow period and the influx of saline water due to the influence of seawater (Sohn et al., 2013). Although the Taehwa-gang mid-level basin achieved the target water quality in 2015, it is necessary to newly establish or change the water quality monitoring representative point of this mid-level basin to other point where the stagnant and reverse flow does not occur. Furthermore, in the case of the Suyeong-gang mid-level basin, the water quality monitoring representative point is located near a wastewater treatment plant and is influenced directly the effluent as well as seawater. In the case of Suyeong-gang mid-level basin, at the time of the master plan in 2006, the monitoring representative point was located upstream of the Suyeong-gang mid-level basin, and the target water quality was also set for the upstream point. Therefore, it is necessary to change the monitoring representative point or the target water quality by assessing the latest water quality or feasibility of the point.
There are some considerations to change the water quality monitoring representative point in the mid-level basin (ME, 2015a). First, the water quality monitoring representative points should be able to reflect the pollutant source of the basin and the water quality of tributaries. Second, they should determine if there is an impact of the formation of stagnant water and the backflow. Third, the flow of the stream at the points should be stable and the accessibility of the points for water sampling should be easy.
3.3 Improvement requirement for revision of the Master Plan
This study also examined the need for additional studies to improve the water environment of non-achieving mid-level basins. According to the policy direction of <The 2nd Water Environment Management Master Plan>, in order to achieve the revised target water quality standard, management of point and non-point pollution sources and improvement of water quality to a level suitable to the watershed characteristics are needed. Also, it is necessary to establish a policy that meets the characteristics of the watershed through a detailed investigation of each basin and to manage special management areas established through the selection of poorly managed basins and the identification of emissions of pollution sources.
BOD and COD are the indicators of organic substance in the current <Water Environment Management Master Plan>. However, due to the problems of BOD5 measurement and COD reduction on toxic and non-degradable substances, respectively, the problem has been continuously issued that the amounts of actual organic substances are less measured (Choi et al., 2015). In these reasons, the criteria for TOC (total organic carbon) which has high oxidizing power and can be measured quickly and accurately in real time, is being suggested. Therefore, it is necessary to newly establish an organic indicator for evaluating the target water quality achievement of <Water Environment Management Master Plan>.
In addition, studies are required for tributaries that are vulnerable to pollutant inflow and affect the water quality of representative points of mid-level basins (Chang, 2005). The Nakdong River mainstream watershed has 800 tributaries, including 11 national streams. The watershed area of the tributaries covers 14,000 km2, accounting for 60% of the total area of the Nakdong River Basin. Each tributary has unique water quality characteristics depending on the watershed environment, flow rate, and local climate. In addition, the environment of small rivers and streams can be easily changed by human activities (Woo, 2010). Thus, it is necessary to the improve water quality of the mainstream in each mid-level basin, including the Nakdong River, through water quality management of the tributaries and also to predict the pollutant flow by developing a water quality model according to the characterization of each tributary. Detailed monitoring of critical management streams is required by classifying the tributaries by grade.
4. Conclusion
In the past, water management policy in Korea focused on basic policies such as improvement of drinking water quality and sanitation, and these policies were merely provisional or temporary policies to address water-related incidents. Even when policies were strengthened, the water environment did not improve significantly. Since the 1990s, policies have been upgraded to improve water quality and ensure a supply of clean water for the four major rivers of Korea. In 2006, <The 1st Water Environment Management Master Plan> was established with the goal of “Clean water, Eco River 2015.” However, in the Nakdong River basin, it was not properly managed and showed low target water quality achievement. After the 1st master plan, the target water quality achievement rate was only 48.5%. It was attributed to some reasons that are the failure to predict the pollutant load, problem of the management of tributaries, the construction of weirs and the problem of setting of the water quality monitoring representative points. This study suggested that improvement of pollution load and tributaries management, feasibility study on water quality monitoring representative points and water quality indicator are needed for the currently undergoing <The 2nd Water Environment Management Master Plan> which has several mid-level basins with enhanced target water quality.