


1. Introduction
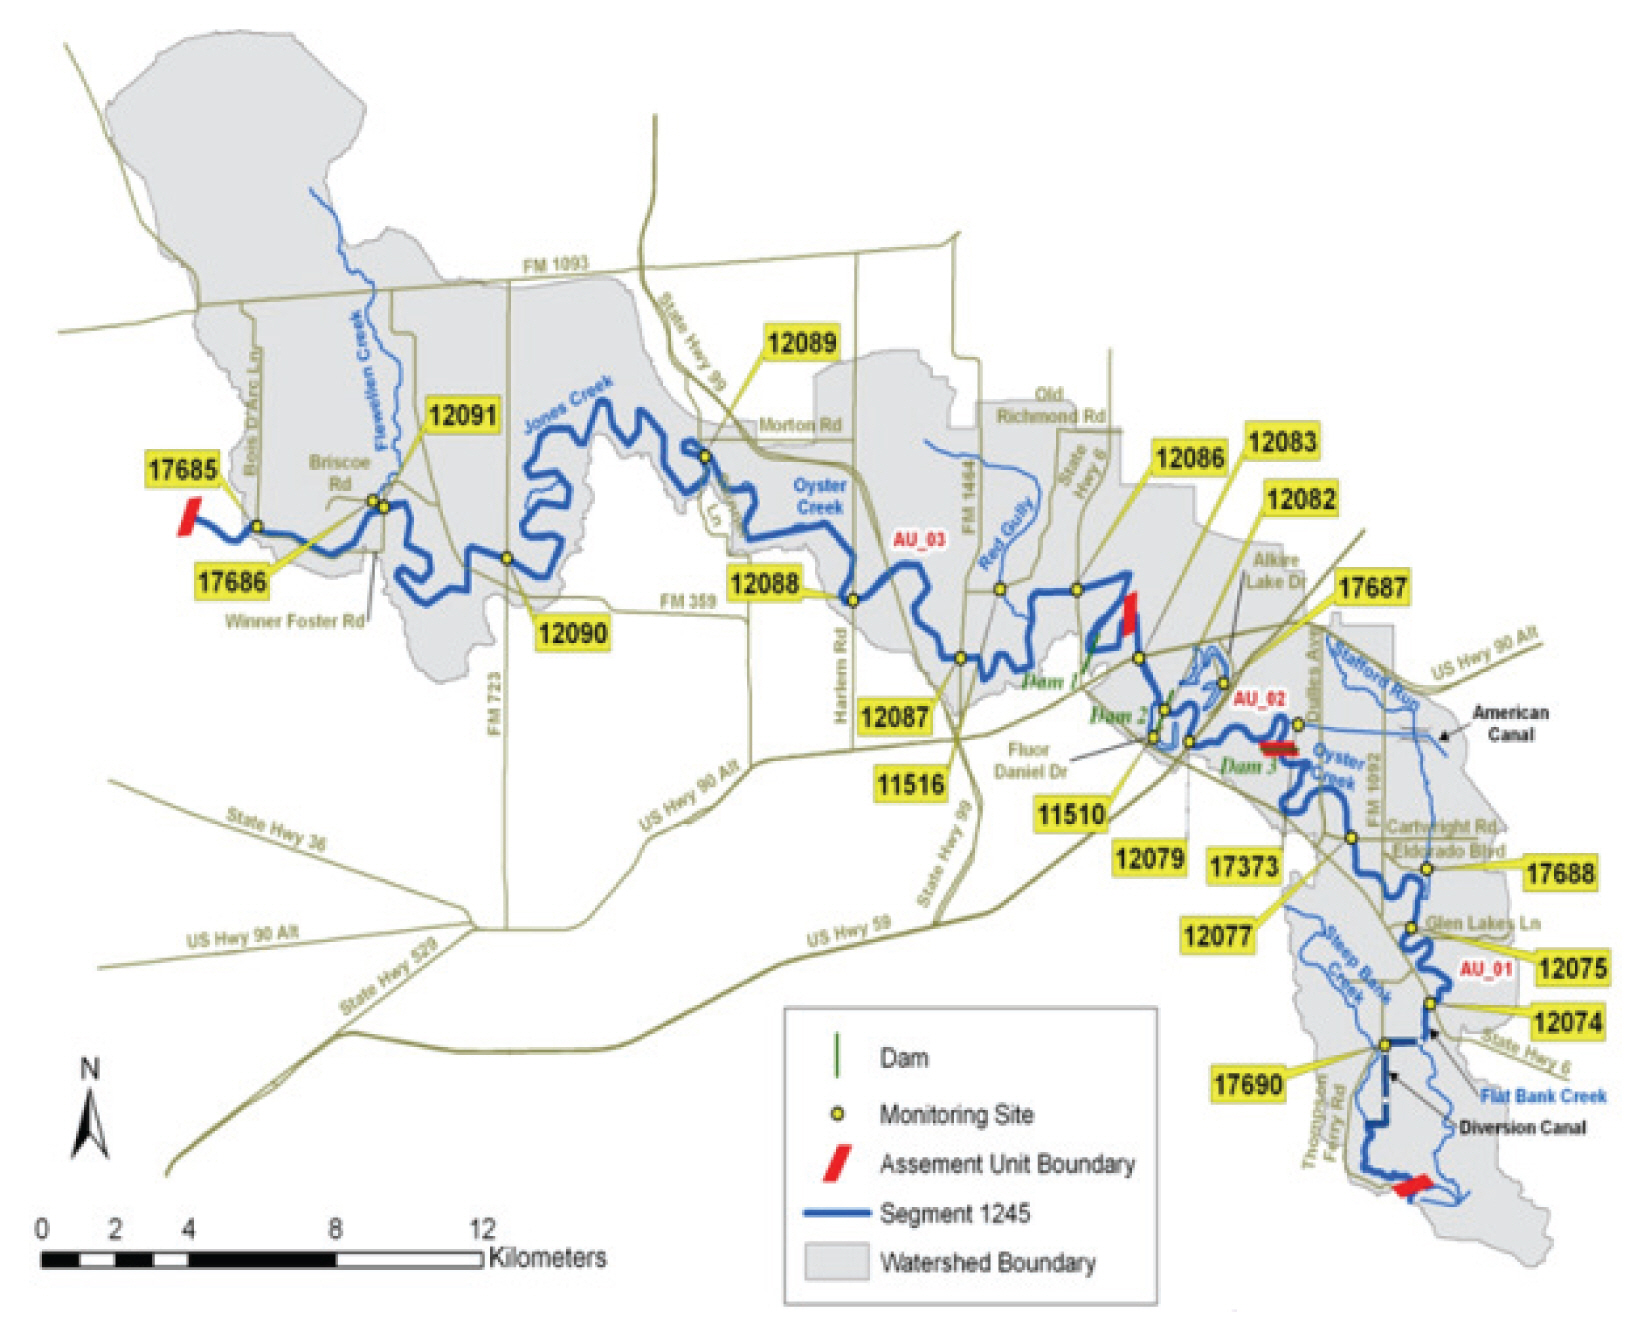
Upper Oyster Creek is located in the Brazos River Basin, southwest of Houston, Texas, in northern Fort Bend County. It is identified as Segment 1245 in the Texas Surface Water Quality Standards (TCEQ, 2010) into three assessment units (AUs) subdivided by Texas Commission on Environmental Quality (TCEQ) shown in Fig. 1 and then first identified the impairment to the contact recreation and aquatic life uses for Upper Oyster Creek in the 1996 Texas Water Quality Inventory and 303 (d) List (TCEQ, 1996). The TCEQ has assessed Escherichia coli (E. coli) concentrations and dissolved oxygen (DO) concentrations for primary contract recreation use and aquatic life use, respectively. The conclusion is that the E.coli concentration is not supportive of the attainment of the SegmentŌĆÖs primary contract recreation use and DO concentration is less than optimal for attainment of Segment 1245ŌĆÖs intermediate aquatic life use (TCEQ, 2007).
In this study, the water quality data for Segment 1245 was downloaded from both TCEQ Surface Water Quality Monitoring Information System (SWQMIS) (TCEQ, 2019) and the Brazos River Authority (BRA) Clean Rivers Programs (CRP) database (BRA, 2019). The data from the two databases were merged to eliminate duplicate entries. The query was restricted by date to those data collected from January 1, 2000 to May 2011. The combined dataset was further reduced to the water quality parameters and relevant monitoring stations needed for this study. For data pertinent to the water quality TMDL, the primary parameter was E. coli and DO. Also, instantaneous streamflow measurement (when available), flow severity, associate field parameter data (dissolved oxygen, water temperature, pH, and specific conductance), nutrient forms (total phosphorus, orthophosphate phosphorus, total Kjeldahl nitrogen, ammonia nitrogen, and nitrite + nitrate nitrogen), total suspended solids (TSS), and volatile suspended solids (VSS) are considered.
In addition, daily rainfall data were obtained for the period January 1, 2000 through December 31, 2010 from the National Oceanic and Atmospheric Administration National Climatic Data Center (NCDC) (NOAA NCDC, 2011). Rainfall data were obtained for these four meteorological stations: Clodine, Richmond, Sugar Land, and Three Rivers for possible use in subsequent analyses . With the use of the above data, this study provides analysis information of relevant water quality data (i.e. e. coli and DO) collected in Upper Oyster Creek (Hauck and Kim, 2011).
The time trends are investigated and collected data are compared. Various statistical methods such as correlation analysis and seasonal pattern analysis (Cowan, 1998) were applied to E. coli and DO data contained in the BRA CRP database and the TCEQ SWQMIS. Even though only 2000-2011 water quality related data that is out of data is used, the statistical data analysis applied in this study is enough to analyze the water quality problems phenomenon and can provide the various views to improve water quality problems in other similar basin that has DO decrease and E. coli increase. Also, water quality independent parameters used in this study and analysis procedures for results can be utilized in other basin because of the data used are surveyed in many other basin with little effort and time and analysis simplicity.
2. E. coli and DO Review to Available Monitoring Stations
Even though the number of E. coli data values was collected at several stations, this study focus on three stations 12090, 12083 and 12074 because other stations have only 2002-2004 years data collection while these three stations have relatively long term data collection for 2002-2011 (Table 1). However, for 2006-2011 years, the sampling for E. coli has been limited to quarterly sampling at only three stations 12090, 12083, and 12074. Specifically, E. coli data collection occurred at several stations during 2004 during 12 sampling events, and these data are excluded from the dataset because the events were purposefully scheduled to capture certain biased conditions including wet weather. Various statistical analyses and graphical presentations of the E. coli data were performed to gain insight into spatial and temporal characteristics. The results of the data analyses are generally described in an upstream to downstream direction following the downstream flow of water. Also, analysis of the assessment unit (AU) shown in Fig. 1 are performed.
Unlikely E. coli data values were investigated at three stations, this study focus on only two stations 12090 and 12083 because no data available at station 12074 (Table 2). Also, no 24-hour DO data were available in the dataset for years 2009-2011. Even though the 24-hour DO data are represented as mean, minimum, and maximum values, the mean and minimum concentrations are more relevant to our purposes than the maximum value because the DO criteria are written in terms of the mean and minimum 24-hour concentrations and the criteria do not include a maximum.
Various statistical analysis and graphical presentations of the 24-hour DO data were performed but the analyses are much more limited in scope than those performed for E. coli because of the paucity of recent DO data collected from 2006 to 2011. In this study, according to difference of sampling types, all sampling periods are divided into two periods as follows: periods 1 as 2002-2005 and period 2 as 2006-2011.
3. Analysis Results
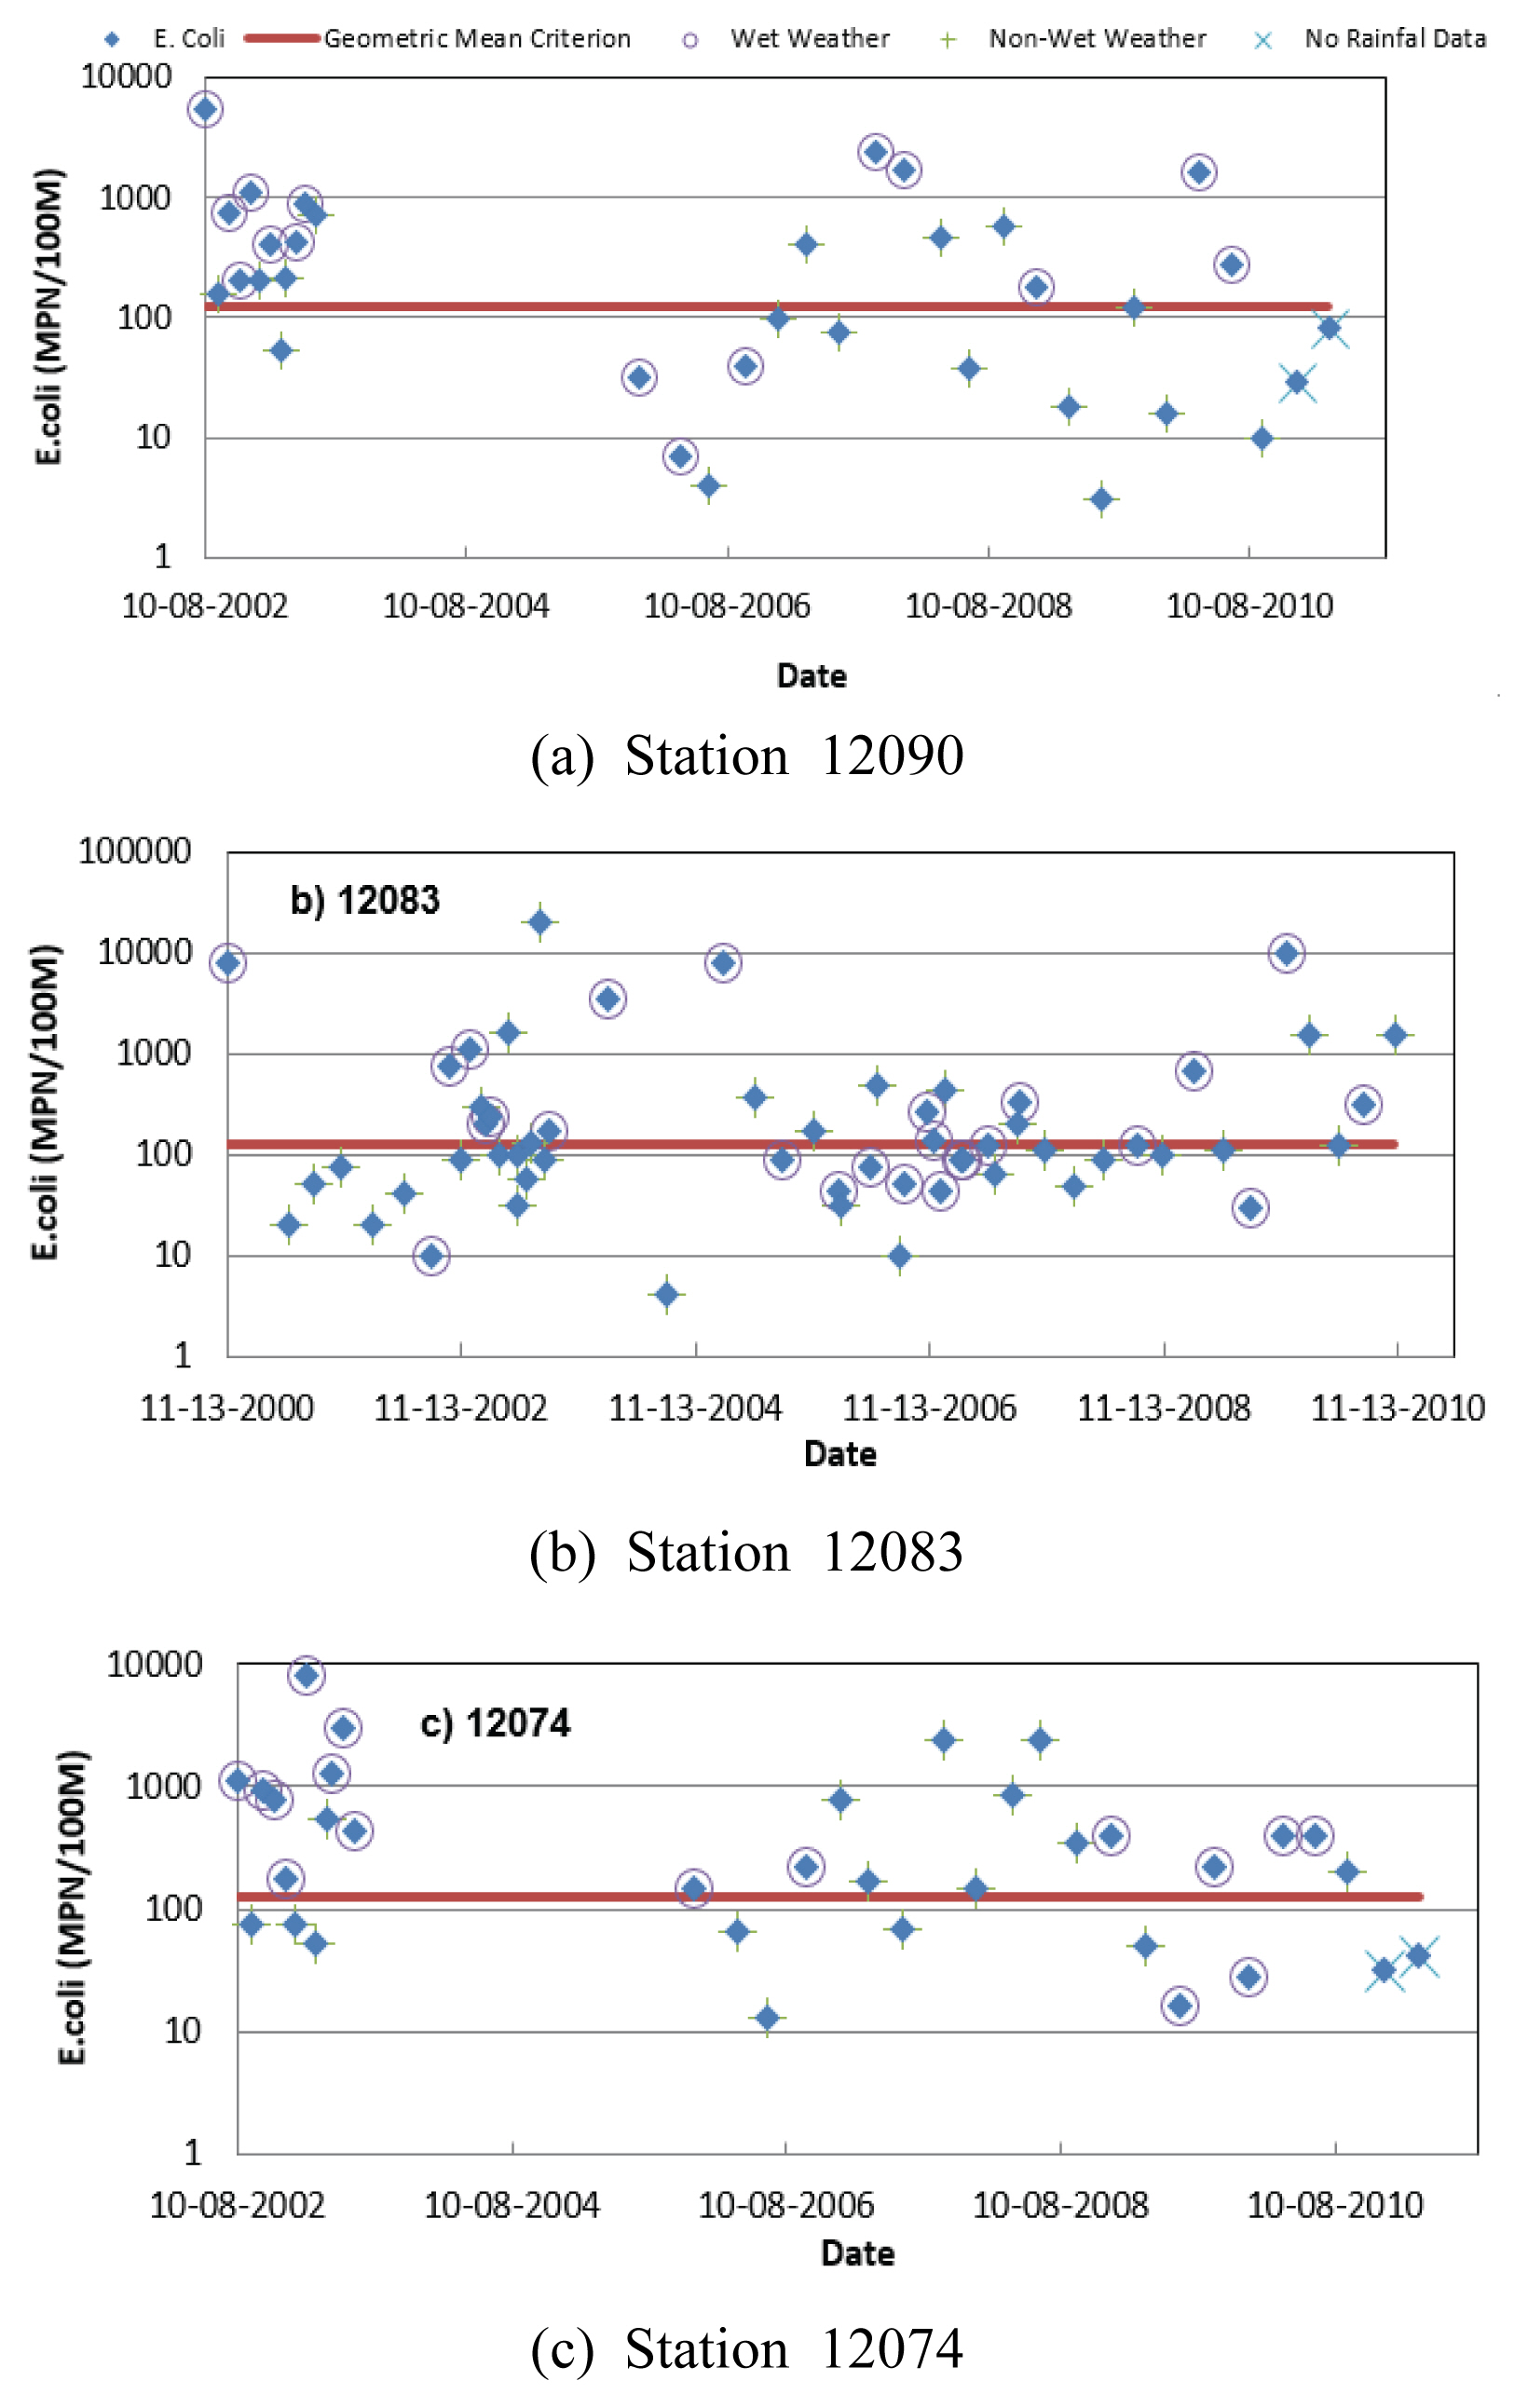
E. coli are generally at low concentrations when water is impounded, because they will settle out of the water column when turbulence is low and are also killed by exposure to sunlight. The geometric mean, minimum and maximum concentrations of the all E. coli data at each monitoring station are provided in Table 1. Based on the criterion of 126 MPN/100ml, the geometric mean concentrations at each station indicated nonsupport of the primary contact recreation use. However, these values do not mean the nonsupport of the primary contact recreation use of the Upper Oyster Creek. Plots of the time history of data are often useful for determining trends (Fig. 2). On each plot, the E. coli data points were indicated as being collected under either wet weather or non-wet weather conditions based on cumulative antecedent rainfall. The time history maintained year 2010 because of no available data for year 2011.
In this study, with the absence of instantaneous streamflow data for most data points, antecedent rainfall was used as a surrogate to indicate likely occurrence of elevated flows during the time of sampling. For all three stations cumulative rainfall was considered on the day of sampling and three antecedent days. However, for station 12090 the cumulative rainfall had to be >0.3 inches for a data point to be considered wet weather and >0.1 inches for stations 12083 and 12074 because of no criterion for determining the dry and wet weathers that depend on watershed characteristics. The more rural setting with less impervious cover for the watershed around station 12090 as compared to the more urban and more impervious cover for the watersheds immediately in the areas of stations 12083 and 12074 was the rationale for two rainfall thresholds. Because of high spatial variability in rainfall for any given storm and differences in response of runoff based on season of the year and days between rainfall events, rainfall does not represent a perfect surrogate to streamflow to indicate the hydrologic conditions under which sampling occurred.
With some exceptions data collected at all three stations under conditions considered as wet weather have high concentrations above the criterion of 126 MPN/100 mL. In contrast, data collected under conditions indicated to be non-wet weather show wide variability with some data points below and some above the criterion. The time history plots indicate that at all three stations measured E. coli concentrations are generally lower in the 2005-2011 years than in 2002 and 2003 years, especially at station 12090. A partial explanation of these visually observable differences in concentrations is the frequency of data collected during wet weather conditions, with an appreciably higher frequency of wet weather data in the earlier years resulting in a greater occurrence of high concentrations. The data at all three stations also indicate that for the non-wet weather data there is a greater likelihood of low concentrations in more recent years than in the earlier years, especially at stations 12090 and 12074. These differences with time in E. coli concentration are even more apparent when the geometric mean concentration is determined separately by station for the earlier and recent data periods (Table 3).
When only the recent data from 2006-2011 is considered, the geometric mean concentration at station 12090 is less than the criterion. The geometric mean concentrations for all three stations show decreases in the more recent period from the means of the earlier period data. Seasonal variations in E. coli data are often difficult to show statistically because of the wide variations in concentrations experienced at most stations. The presence or absence of statistically significant differences in concentrations within a year, however, can have significance regarding implications on primary contract recreation use, which is more likely to occur during the warmer months than in cooler months. For example, if high E. coli concentrations above the criterion predominately occur during the cooler months and low concentrations below the criterion predominately occur during warmer months, then that information could have importance in determining whether or not a segment supports the primary contract recreation use.
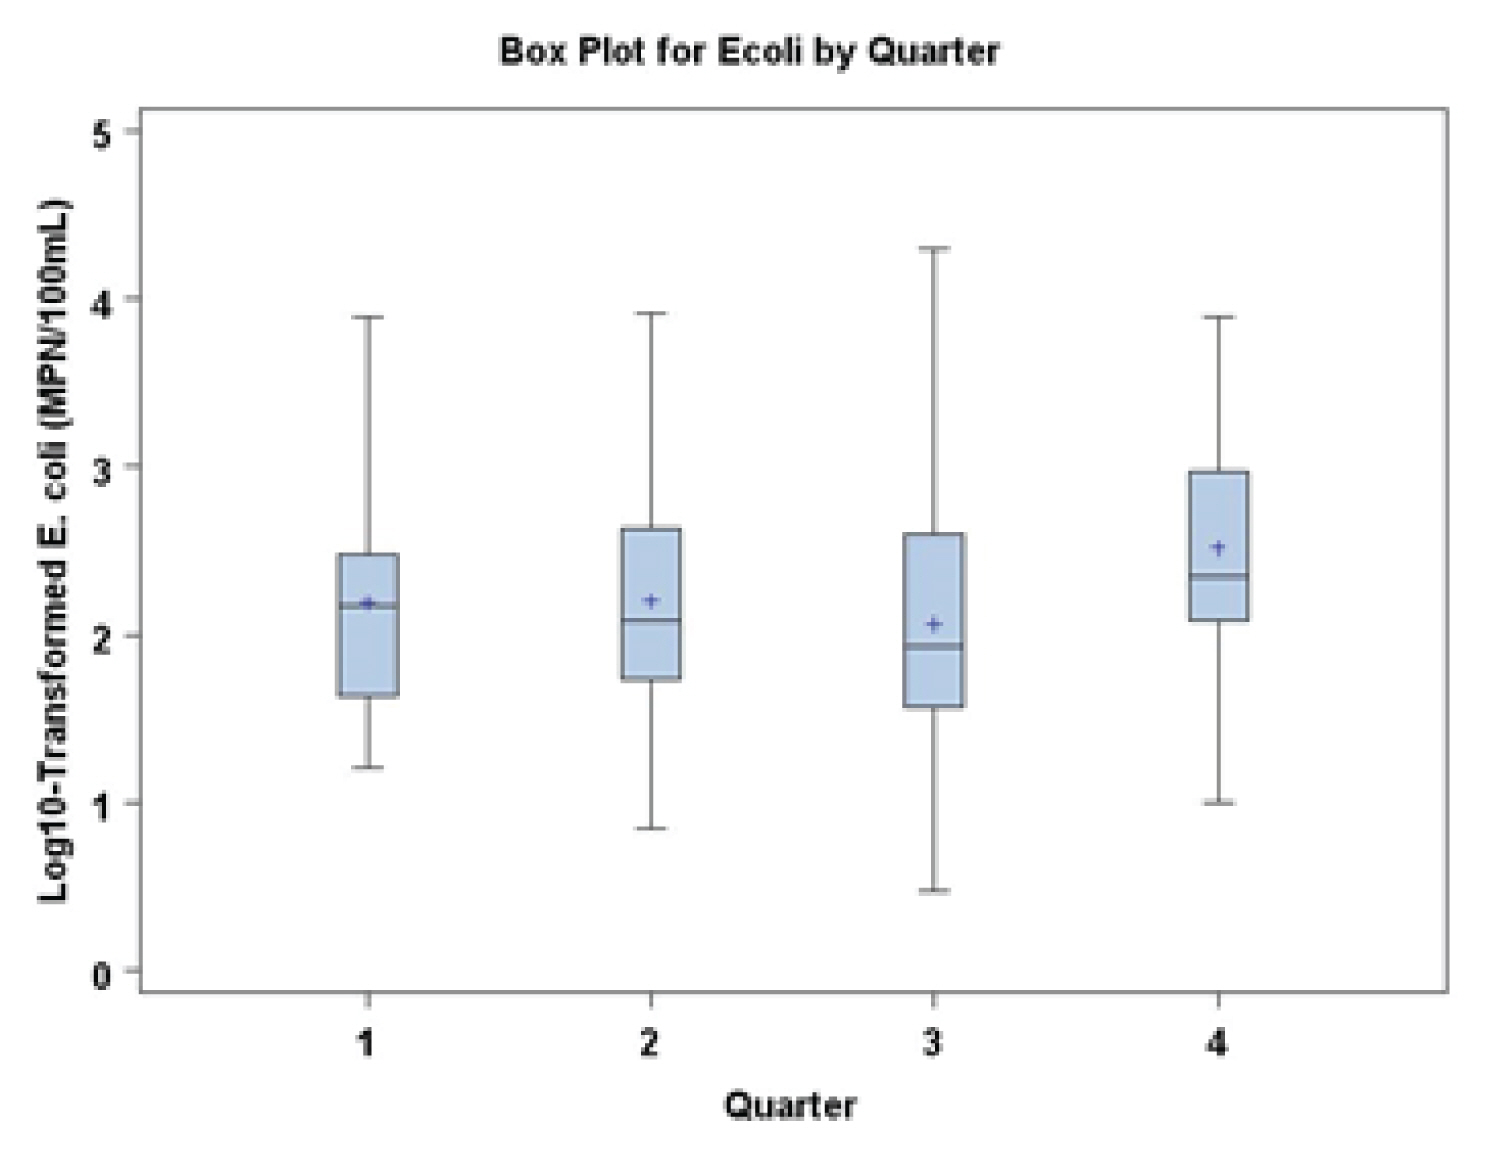
This seasonal analysis was performed at the three stations 12090, 12083 and 12074 that have the longest record of data. Further, after 2006 year, E. coli data have only been collected in the months of February, May, August, and November. As a result of this pattern in the data, the seasonal analysis could not be performed by evaluating each month of the year, but was performed considering four seasons. As a first step, the E. coli data for each station was compared to the other two stations to determine if there were statistical significant differences in the population of data points at each station. No significant differences between the data for each station were found according to a Cochran T-test and HartleyŌĆÖs F-test (Cohen, 1988), allowing the data for each station to be combined into one large dataset for the seasonal analysis. The combined dataset of all three stations were separated into four seasons and then analyzed using Cochran T-test. Each E. coli data point was placed in the quarter representing the date of sample collection: Quarter 1 (January ŌĆō March), Quarter 2 (April ŌĆō June), Quarter 3 (July ŌĆō September), and Quarter 4 (October ŌĆō December). For ╬▒ = 0.05, a significant difference was determined between Quarter 3 and Quarter 4 populations, but no other seasonal comparisons showed any significant differences. The seasonal data are displayed graphically in Fig. 3 using box plots where the lowest mean and median concentrations are associated with Quarter 3 and the highest mean and median concentrations are associated with Quarter 4; the two quarters indicated to have differences in the measured E. coli data concentrations.
To evaluate the relationship between various factors and E. coli concentrations, correlation analysis was performed for the three stations (stations 12090, 12083, and 12074) with long-term data. Linear regression methods employing least-squares criterion were used to perform the desired analysis. The correlation coefficient was used to evaluate the strength and direction (i.e., negative or positive correlation) of relationships between E. coli as the dependent variable and various independent variables. The correlation coefficient, r, is a measure of how well two sample populations vary jointly and can have values over the interval of -1.0 to 1.0. A value of r close to +1 or -1 indicates a highly positive or negative degree of correlation and a good fit to a linear model, whereas a value of r close to 0 indicates a poor fit to a linear model. For these analyses a weak, moderate, or good strength of linear relationship between two variables is defined by r in the ranges. The weak, moderate, and good relationship were ranged from -0.59 (0.59) to 0.00, from -0.79 (0.79) to -0.60 (0.60), and from -0.80 (0.80) to -1.00 (1.00) in negative (positive) index, respectively (Cohen, 1988; Santhi et al., 2001; Van Liew et al., 2003). While linear regression analysis does not establish cause and effect responses, the approach does lend itself into gaining insights into relationships of E. coli to other variables within Upper Oyster Creek. These relationships can then be interpreted based on established responses from principles and observations of aquatic biology, water chemistry, and environmental engineering that indicate likely cause and effect responses and infer conditions favorable to the occurrence of elevated E. coli concentrations. For this analysis, unlike any of the prior analyses, the biased E. coli data collected in 2004 were included as data points. For correlation analysis the purpose is not to restrict the data to those values collected in an unbiased manner for assessment purpose, but rather to include data collected over as wide a variety of circumstances as possible to enhance the possibilities of discovering meaningful relationships of E. coli to other parameters. The independent parameters were limited to water quality constituents associated with a majority of the data points (i.e., parameters collected or sampled at the same time as the E. coli data collection). These constituents included total suspended solids, various numbers of cumulative antecedent rainfall as a surrogate for streamflow, and the basic field parameters of specific conductance, dissolved oxygen, dissolved oxygen percent saturation, pH, and water temperature. Nutrient and streamflow data were not collected with many of the E. coli samples so these potential independent parameters were excluded from further consideration. Prior to performing the analysis, the E. coli data were all log transformed to minimize the effects of high concentrations in unduly weighting the correlation coefficient to artificially high values; an effect known statistically as occurring with ŌĆ£leverage points.ŌĆØ
The results of the analysis were disappointing in the sense that only weak linear relationships were indicated at any station and for any independent parameter except for days since precipitation event for station 12090 and day 3 cumulative antecedent rainfall at station 12074, which showed barely moderate strength of relationships (Table 4). The complexities of the hydrology of Upper Oyster Creek, which includes substantial amounts of water pumped from the Brazos River and the series of three small dams, is a likely cause of the low r values that were determined. Not having an adequate set of instantaneous flow measurements, which precludes its inclusion as an independent parameter, also removed one suspected important parameter. Nonetheless, the consistency of the direction of the correlation for several independent parameters provides a weight of evidence that E. coli concentrations in general are higher at higher streamflows that are associated with stormwater runoff than at lower non-stormwater driven streamflows. These independent parameters include specific conductance, days since precipitation event, flow severity, and the cumulative antecedent rainfall parameters.
Specific conductance, which is a measure of the amount of dissolved salts in the water, is generally lowered by the diluting effects of stormwater. Hence, the negative r value of the E. coli to specific conductance correlation is a possible response of higher bacteria concentrations and lower specific conductance values under stormwater runoff conditions. Similar reasoning supports the consistently negative correlation of E. coli to the parameter of days since precipitation events, i.e., when bacteria data are collected further removed in time from a precipitation event influences of stormwater to raise concentrations are diminished. The consistently positive r values associated with flow severity and the four cumulative antecedent rainfall parameters are more intuitive than the previous two parameters. That is, as flow severity increases and cumulative rainfall increases, the influence of stormwater runoff on increasing E. coli concentrations increases resulting in an anticipated positive r value. However, again, none of the r values for the relationship of E. coli to these independent parameters is even moderately strong, except days since precipitation at station 12090 and day 3 cumulative antecedent rainfall at station 12074. Rather it is more the consistency of the direction (negative or positive value) of the r values to the direction of response should stormwater runoff generally increase E. coli concentrations that provides a weight of evidence supporting the cause and effect of increased E. coli concentrations under stormwater runoff conditions.
Total suspended solids (TSS) is a contrary parameter regarding r values and the hypothesis regarding stormwater runoff, especially the very weak negative r value at station 12090. The anticipated response would be that stormwater runoff not only carries increased levels of E. coli, but also increased levels of TSS as typically observed by the muddy water occurring during and after rainfall runoff events. Here the complexity of the hydrology likely masks the strength and even the sign of the anticipated relationship of E. coli to TSS, which would be positive r values. However, the Brazos River is typically very muddy (i.e., high in TSS) and these muddy waters are pumped into Segment 1245 at its upstream end having their greatest influence on the most upstream of the three stations, 12090. It is not unreasonable to conclude that the generally high TSS concentrations associated with pumped Brazos River waters distorts the anticipated association of E. coli to TSS at station 12090. The high TSS values in the pumped waters and the general decrease in TSS concentrations in the downstream direction from the pump station due to settling of the solids was discussed in the technical support documents for the DO TMDL (Hauck and Du, 2007).
The mean and minimum 24-hour DO data for each station with 10 or more data points in Table 2 were summarized. The 24-hour mean DO data are presented as the average, minimum and maximum values for each station in Table 2. These basic statistics indicate that each station has an average for the 24-hour mean that is above the criterion of 4.0 mg/L set to protect the intermediate aquatic life use, but the minimum 24-hour mean value for each station is below the criterion. Similarly, the 24-hour minimum basic statistics are shown in Table 3; also showing averages above the 24-hour minimum criterion of 3.0 mg/L and minimum values below this criterion.
Plots of the time history of DO data are often useful for determining trends and also for visualizing how many data points do not meet the relevant DO criterion. For the present study the time period of data and amount of data are insufficient to warrant detailed analyses. The time history plots were developed for the two stations 12090 and 12083 (Fig. 4). The time history graphs for station 12090 indicate fewer excursions below the relevant numeric criterion for the data collected in 2007 and 2008 than the earlier data from 2003-2005, which is similar to the water quality improvement shown in the E. coli time history plot for the station. In contrast, the time history graphs for station 12083 indicate generally the same number of excursion for both the more recent (2006-2008) and earlier periods of data collection, which is somewhat similar to what was shown in the E. coli plot for this station. Actual comparisons of the average concentrations for the 24-hour mean and 24-hour minimum for the two time periods confirm what (Table 3) was observed in the time history plots. Both the 24-hour mean and minimum concentrations are approximately 1 mg/L higher at station 12090 for the more recent data collection period when compared to the earlier data period. For stations 21083 the comparisons of the two data collection periods indicate similar 24-hour mean and minimum concentrations for both periods.
4. Summary and Conclusions
The analyses of the E. coli data from January 2000 through May 2011 indicated three stations 12090, 12083, and 12074 with a consistent record of data going into 2011. Analysis to determine if there is a seasonal pattern to the E. coli data showed that the data were statistically higher in Quarter 4 (October ŌĆō December) as compared to Quarter 3 (July ŌĆō September), though all other comparisons of the four quarters of the year showed no differences. Time history plots and basic computations of geometric mean concentrations indicate decreasing concentrations in the period 2006-2011 years when compared to the period of 2000-2005 years. This decreasing trend in E. coli concentrations is greatest at station 12090 and least at station 12083. Because of the absence of streamflow measurements to associate with E. coli data, it is impossible to make direct statements regarding occurrences of generally higher E. coli concentrations in association with stormwater runoff events than for data not associated with runoff influences. However, the weight of evidence from correlation analysis of E. coli to other parameters (e.g., flow severity observed by field crews collecting data, cumulative antecedent rainfall, and days since precipitation event) indicates that E. coli concentrations are most likely to be higher under the influence of stormwater runoff than when such influences are absent or diminished.
The analyses of the DO data from January 2000 through May 2011 indicated two stations 12090 and 12083 with a consistent record of data going into 2008. Within 2009-2011 years no 24-hour data were found in the databases searched for this study. Time history plots and comparisons of data based on separation into two time periods (2000-2005 and 2006-2008) show that both 24-hour mean and minimum concentrations are approximately 1mg/L higher in the 2006-2008 period than the 2000-2005 period for station 12090. In contrast, the time history plots and comparison of two time periods for station 12083 show roughly the same pattern and concentrations for both time periods. The lack of any data for the last three years limits the ability to draw conclusions regarding recent conditions for these two stations. To improve the analysis results of the relationship among several water quality data, selection of alternative analysis methods such as multiple linear regression is recommended with collection of water quality data with long periods that cover at least 20 years. With theses preparation, further analysis could be performed and provide more meaning analysis results. Due to available data constraint, the study has many difficult to analyze the DO and E. coli. However, the analysis results of this study has provided the insight of water quality improvement for water related contact recreation and aquatic life use since 1996. Also, the statistical analysis methods applied in this study can be used for other river basin that has similar water quality problems.