Inelastic Lateral-Torsional Buckling Strength of Steel I-Beams under Non-Uniform Temperature Conditions
Article information
Abstract
본 연구는 온도변화 영향을 받는 I형보의 비탄성 횡-비틀림좌굴거동 특성을 평가분석하고 있다. 유한요소해석 프로그램 ABAQUS를 해석연구에 사용하였으며, I형보에 균일모멘트를 하중으로 작용하고, 온도영향은 표준온도인 20℃에서 고온인 600℃까지 고려하였다. 비선형좌굴해석을 위해 잔류응력과 기하비선형의 초기변형을 고려하였다. 해석결과로부터 보 전체에 온도영향을 반영한 경우에 강도감소가 가장 크게 발생하였으며, 인장부재보다는 압축부재에 온도영향을 반영하였을 때 좌굴에 보다 취약한 결과를 얻을 수 있었다. 보 전체에 600℃ 온도하중을 반영하였을 때 77%의 강도감소가 발생하였으며, 인장플랜지의 50% 범위에 600℃ 온도하중을 반영하였을 때 13%의 강도감소를 나타내었다. 국부적으로 온도영향을 받은 부분에서 국부좌굴이 발생하기 시작하며, 최종적으로 전체좌굴이 발생되는 좌굴모드 진행을 확인할 수 있었다.
Trans Abstract
This study assessed the inelastic lateral–torsional buckling behavior of steel I-beams under elevated temperatures. Numerical simulations were conducted using the finite element program ABAQUS. The beam models were subjected to uniform bending and varying temperature loads from a normal temperature of 20 ℃ to an elevated temperature of 600 ℃. These thermal loads were applied at the compression flange, tension flange, half of the beam, and throughout the entire beam. The combined effects of residual stress and geometric imperfection on the inelastic buckling strengths of the beams were also considered. The results showed that the scenario in which the entire beam was heated demonstrated the highest strength degradation. In addition, the compression flange of the beam was observed to be critical; thus, the local buckling of the compression flange greatly contributed to the decrease in the buckling strength compared with the other cases.
1. Introduction
Steel members have been widely used as structural element for horizontal and vertical structures, such as buildings and bridges, but most of them are not provided with fire protection coatings. At elevated temperature, structural steel members are more sensitive and vulnerable than other materials. This is due to high thermal conductivity and rapid degradation of strength and stiffness which lead to decrease in load carrying capacity and eventually buckling failure. In recent years, the effects of elevated temperatures on the buckling behavior of steel I-beams has been extensively studied. Real and Franssen (2001) and Real et al. (2008) studied the lateral–torsional buckling capacities of carbon and stainless steel I-beams under fire condition. Couto et al. (2016) numerically investigated the lateral–torsional buckling of steel I-beams with slender cross section under fire. Varol and Cashell (2017) numerically investigated the lateral torsional buckling behavior of laterally unrestrained high strength steel beams at ambient and elevated temperature. Beam models from these studies were simulated and analyzed using finite element softwares in which the thermal loads are applied to the whole beam. Zang et al. (2013) investigated the effects of localized fires and the temperature gradients on the lateral torsional buckling of simply supported laterally unrestrained steel beams. In which the localized fire are applied at the lower mid-portion of the beam and propagates throughout the whole member. However in actual fire scenarios, localized fire can be exposed to other parts of the steel beams, such as at the compression and tension flange, or half of the beam. The analysis of the buckling behavior of steel conducted.
Thus, this paper aims to analyze the inelastic buckling strength of simply supported laterally unrestrained steel beams with compact cross sections subjected to pure bending and elevated temperatures. The thermal loads are applied at the compression flange, tension flange, whole beam, half of the beam, half of the compression flange, and half of the tension flange. The temperature ranges from 300℃ to 600℃ with an interval of 100℃.
2. Finite Element Modeling
A finite element program, ABAQUS (2013), was used to perform the numerical analysis of the inelastic buckling capacities of steel beams at ambient and elevated temperature.
2.1 Development of FE Model
The numerical study consists of two types of analyses, the heat transfer analysis for the propagation of thermal loads; and the static riks analysis for the application of uniform moment. In the heat transfer analysis, beams were modeled as 4-noded DS4 heat-transfer quadrilateral shell. While in the static riks analysis, beams were modeled as S4R shell elements.
The beam section used in the analysis was a W30x148 beam, that were obtained from the AISC manual (2011) and generally used for beam system. The cross-section of the beam is shown in Fig. 1 The beam was categorized as compact section in the AISC manual (2011) and Class 1 cross-section based on Eurocode 3 Part 1-1 (2005). The material properties at the ambient temperature were elastic modulus of 210 GPa, yield stress of 275 MPa, and a Poisson’s ratio, μ, of 0.3. For this study, varying unbraced lengths of 5 m, 7 m, 9 m, 12 m, 15 m, and 18 m were considered.

W30×148 Cross Section
The mechanical load was applied at each ends of the beam and was expressed as the tension and compression forces at the bottom flange and the top flange, respectively, generating a uniform bending moment. Fig. 2 demonstrates the boundary condition of the models, in which all the beam models were simply supported. Point A was assumed to have hinge support, where the displacements at x, y, and z directions and the rotation about the x axis were restrained. While point B was assumed to have roller support, where the displacement in directions y, z and the rotation about the x axis are restrained. Lastly, lines W and F were restrained against y and z displacements, respectively.
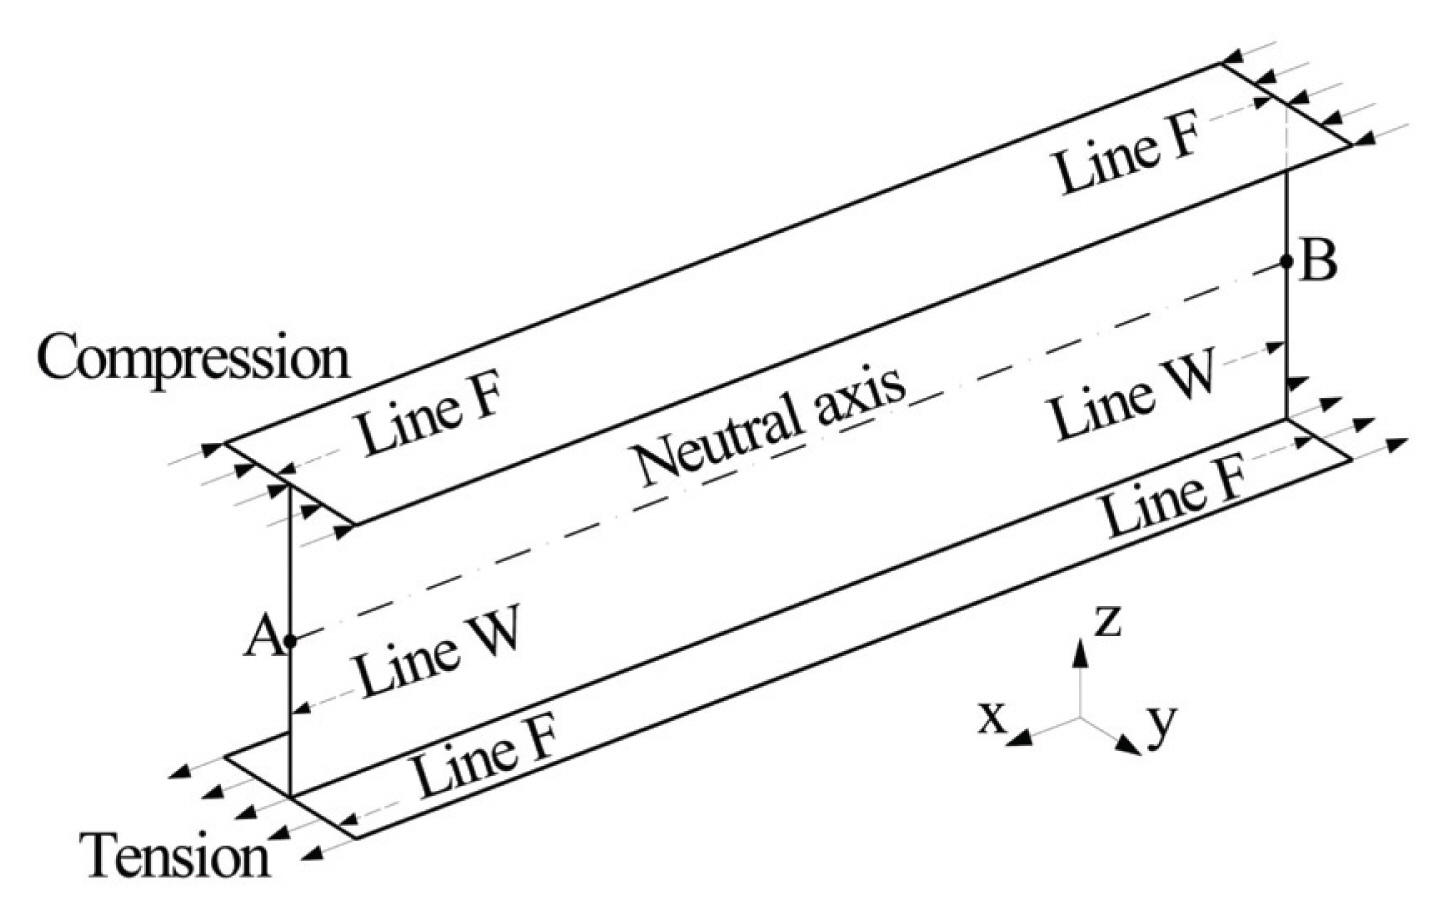
Loading and Boundary Conditions
The application of thermal loads (ISO-834, 1999) were shown in Fig. 3 Beam models were divided into six types based on the temperature exposure area. They were temperature exposed over whole beam (F-WB), compression flange (F-CF), tension flange (F-TF), 50% of whole beam (50%F-WB), 50% of compression flange (50%F-CF), and 50% of tension flange (50%F-TF).

Heat Transfer Boundary Conditions
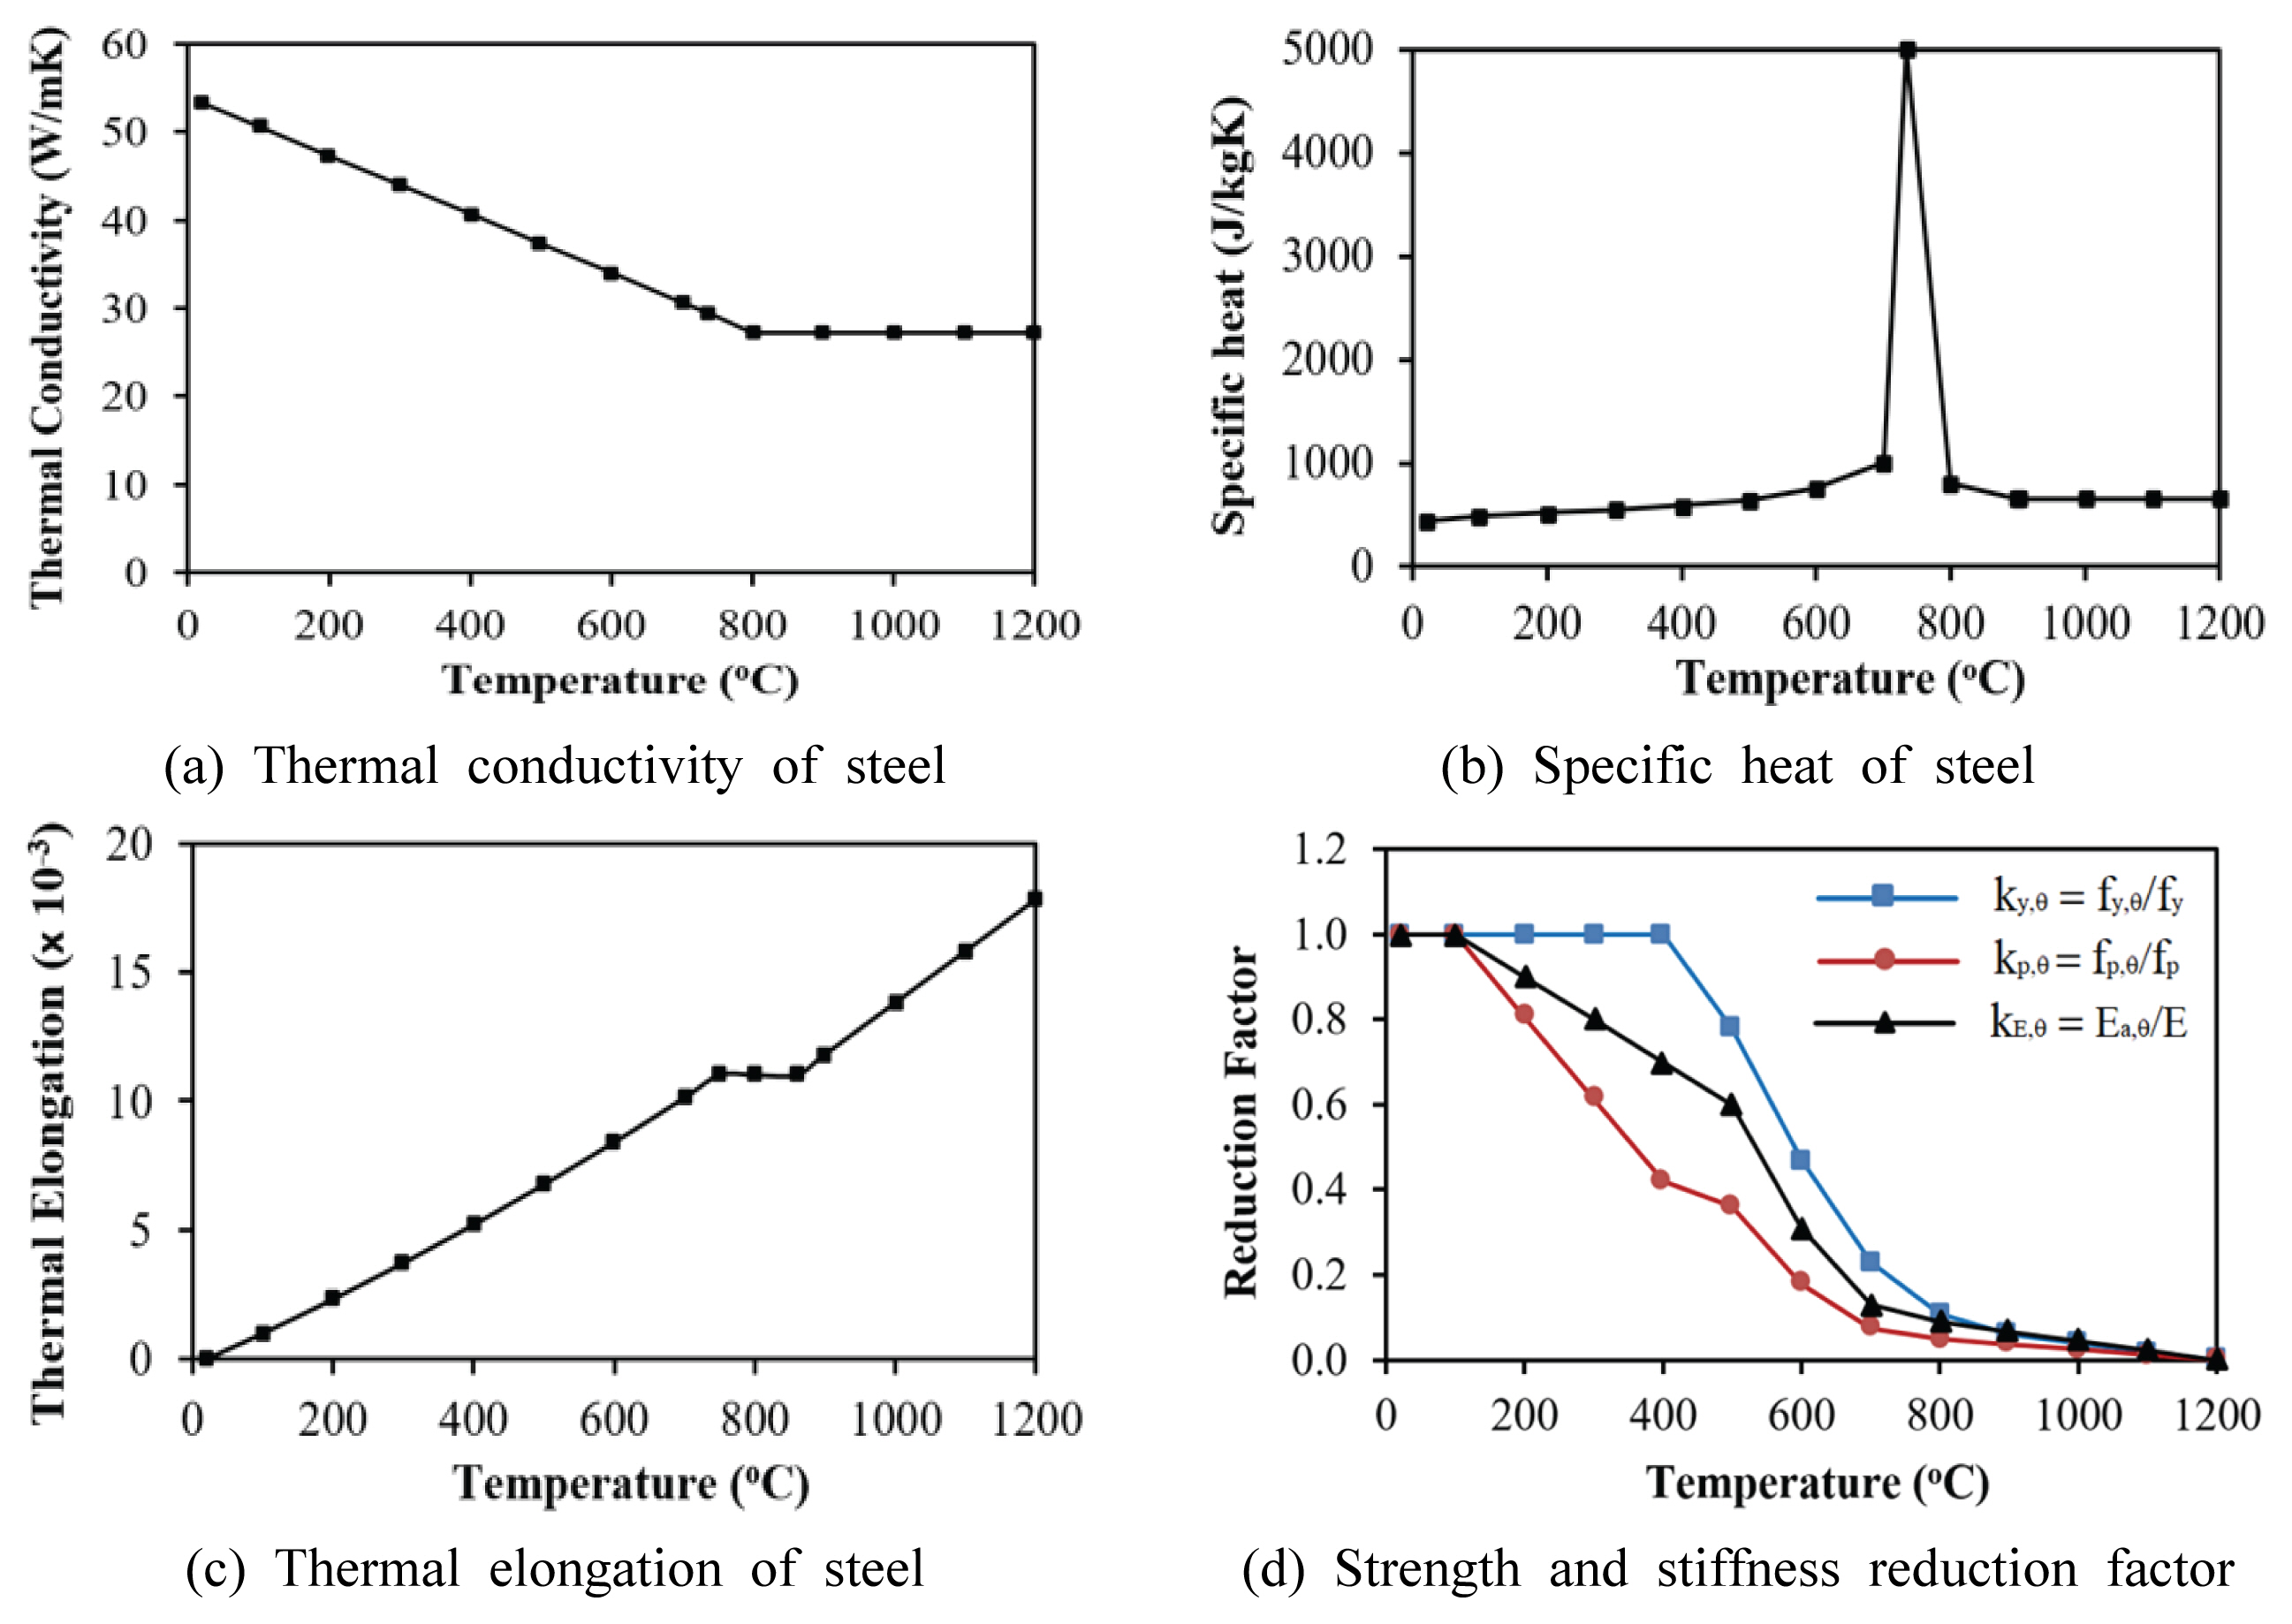
As mentioned previously, properties of steel changes when exposed to elevated temperatures. Thus, the temperature-dependent properties of steel such as thermal and mechanical properties, must be considered in the analysis.
Figs. 4(a) and (b) illustrates the variation of thermal conductivity and specific heat that were obtained from formula as given in Eurocode 3 Part 1-2 (2005). In addition, the density of steel was assumed to be 7,850 kg/m3 regardless of the temperature.
Material Properties of Steel
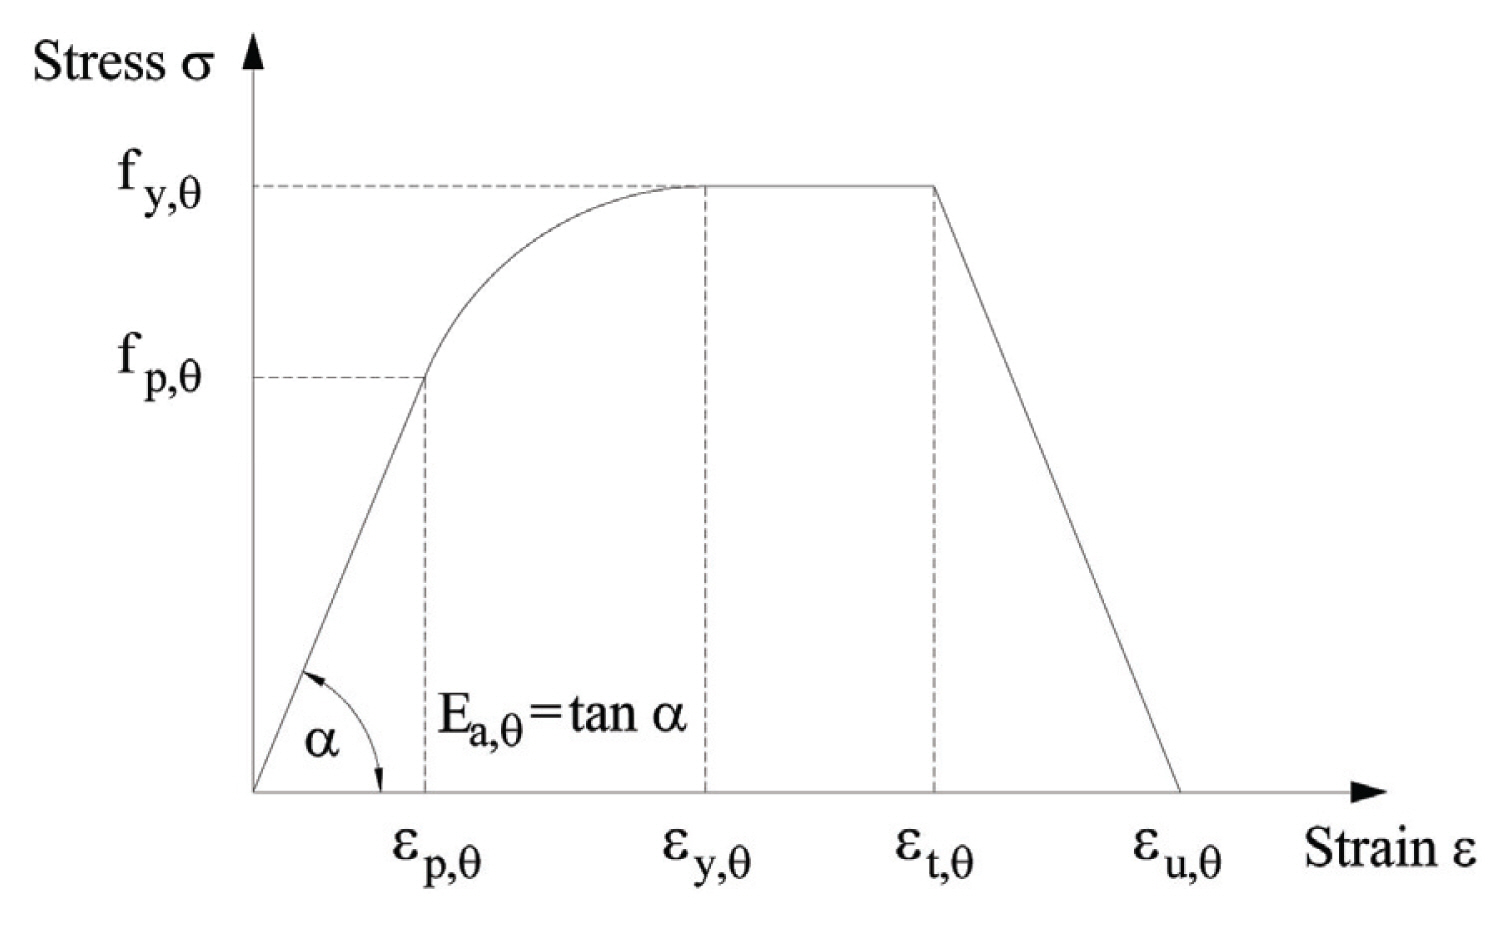
The mechanical properties of steel includes the elongation coefficient, the yield strength, Young’s modulus and stress-strain relationship. The elongation coefficient was described in Eurocode 3 Part 1-2 (2005) as shown in Fig. 4(c) Reduction factors were employed to depict the degradation of the proportional limit (kp,θ=fp,θ/fp), yield strength (ky,θ=fy,θ/fy) and Young's modulus (kE,θ=Ea,θ/E) at elevated temperature, as shown in Fig. 4(d) In this figure, fp,θ, fy,θ and Ea,θ represent the proportional limit, effective yield strength and slope of the linear elastic range, at a temperature θ, respectively. Lastly, Fig. 5 shows the stress-strain curve at elevated temperature for hot rolled steel taken from Eurocode 3 Part 1-2 (2005).
Stress-strain Curve at Elevated Temperature
Initial imperfections of residual stress and geometric imperfection were introduced to the numerical models as illustrated in Fig. 6 The residual stress followed the pattern from ECCS (1984). While the initial imperfection is set at 1/1000 of the unbraced length which was taken from the study of Avery and Mahendran (2000).
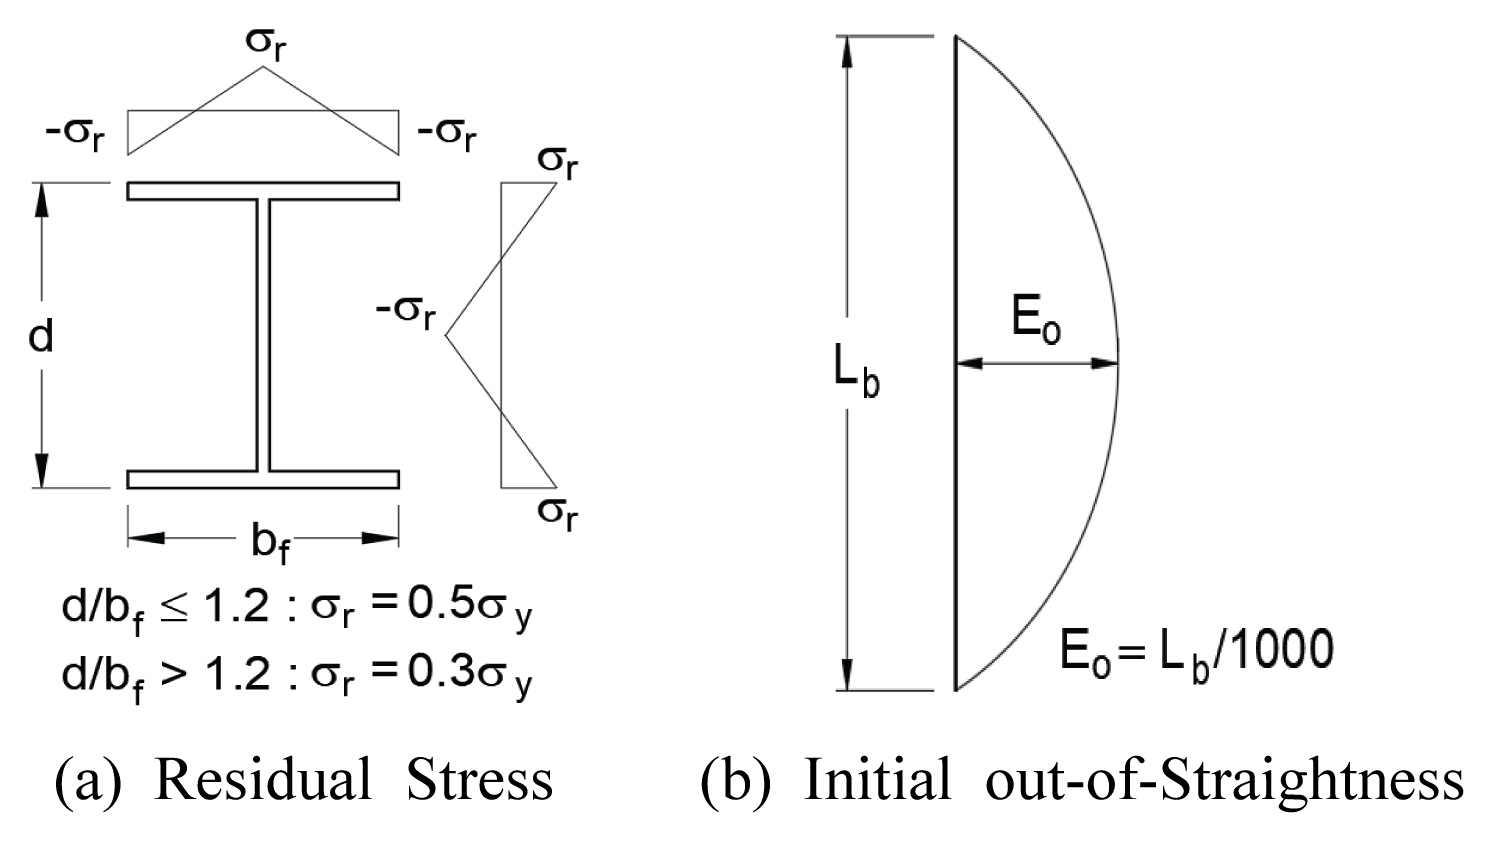
Initial Imperfections
2.2 Model Validation
A comparison between the of the FE analysis and calculated buckling strengths from Eurocode 3 Part 1-2 (2005) were conducted to validate the accuracy of the simulated models. The beams were assumed to be heated throughout the beam (Case F-WB). The results were plotted terms of the reduction factors for lateral-torsional buckling (χLT and χLT,fi at ambient and elevated temperature, respectively) and different slenderness values (λLT and λL,fi at ambient and elevated temperature, respectively).
At ambient temperature, the reduction factor for lateraltorsional buckling (χLT) and the non-dimensional slenderness (
Where Mb,Rd is the design buckling resistance moment, Mc,Rd is the design resistance for bending, Wpl,y is the plastic section modulus of the cross-section and Mcr is the elastic critical moment for lateral-torsional buckling.
At elevated temperature, the reduction factor for lateral torsional buckling in the fire design situation (χLT,fi) and the non-dimensional slenderness values (
Where Mb,fi,t,Rd is the design lateral torsional buckling resistance moment and Mfi,θ,Rd is the fire design moment resistance.
Figs. 7 and 8 illustrate the comparison of results between FE and Eurocode at ambient temperature and elevated temperature, respectively. It can be observed that the simulated models and the calculated strengths from Eurocode behaved similarly with reasonable accuracy. These validate the FE models for investigating the inelastic buckling behavior of steel beams at elevated temperature.

Comparison of the Numerical and Design Values for χLT and λLT at 20 °C
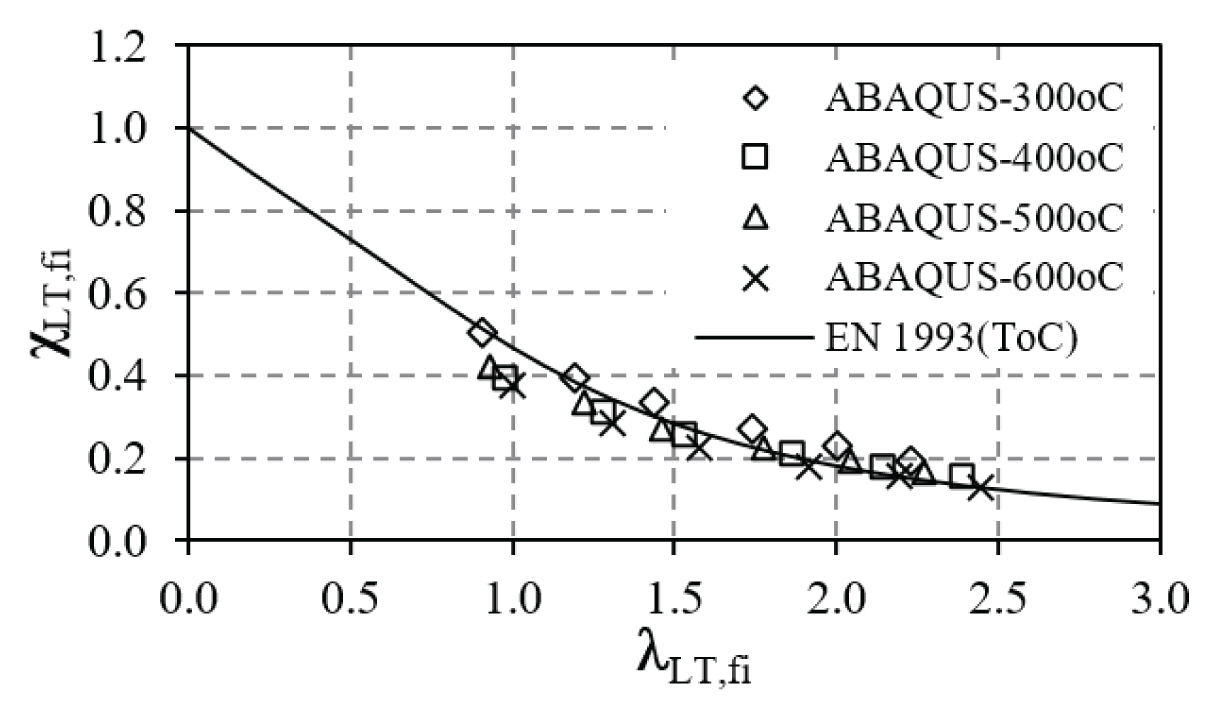
Comparison of the Numerical and Design Values for χLT,fi and λLT,fi at Elevated Temperature
3. Analysis Results
3.1 Critical buckling load
Geometric and material non-linear analysis with imperfections using shell finite element models were carried out. Eurocode 3 Part 1-6 proposed a method to define the buckling resistance on the load-strain curve shape. According to Eurocode 3 Part 1-6 (2007), a geometric and material non-linear analysis should be performed on the perfect structure to determine the perfect elastic-plastic buckling resistance ratio. The imperfect elastic-plastic buckling resistance should be found as the lowest load obtained from the three following criteria;
• Criterion C1: The maximum load factor on the loaddeformation-curve (limit load);
• Criterion C2: The bifurcation load factor when this occurs during the loading path prior to reaching the limit point of the load-deformation-curve;
• Criterion C3: The tolerable deformation when this occurs during the loading path prior to reaching a bifurcation load or a limit load.
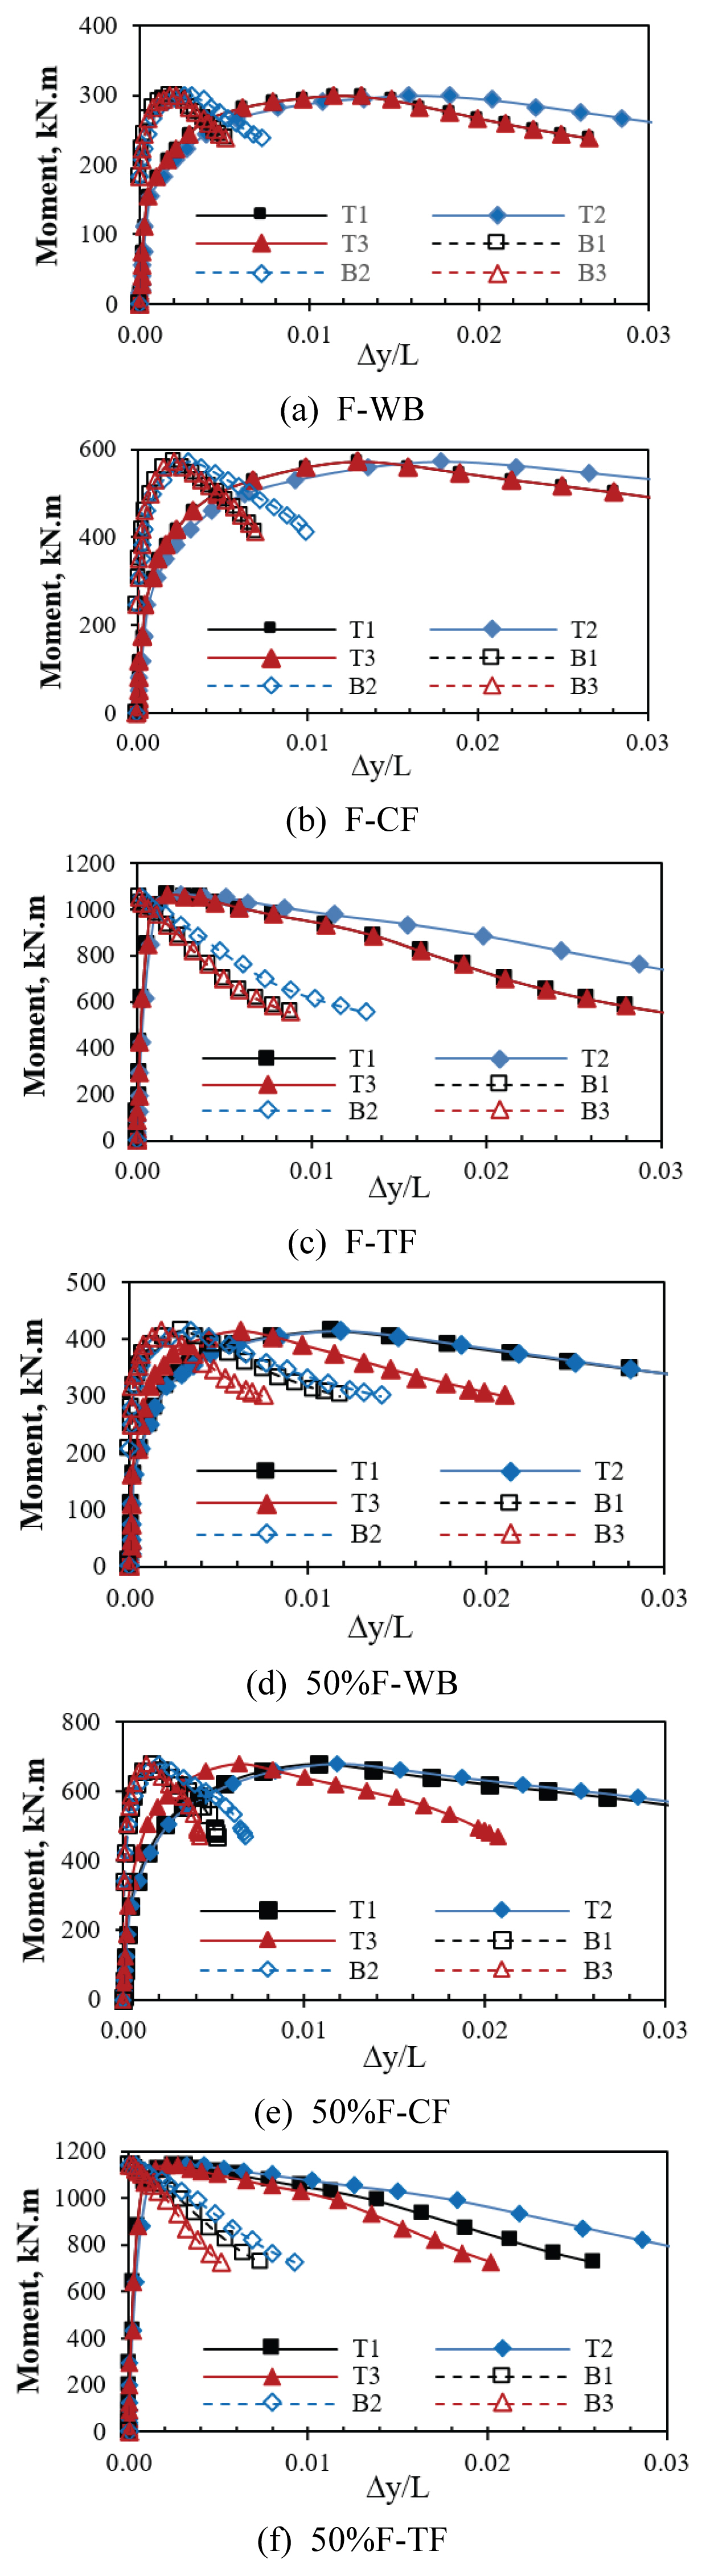
The load-deformation curves at 20 ℃ and 600 ℃ at the points T1, T2, T3, B1, B2 and B3 (as shown in Fig. 9) with a length of 7m are presented in Figs. 10 and 11 The load-deformation curves are the most similar to the criterion of C1 which is selected as the critical buckling load.

Points for the Load-deformation Curve
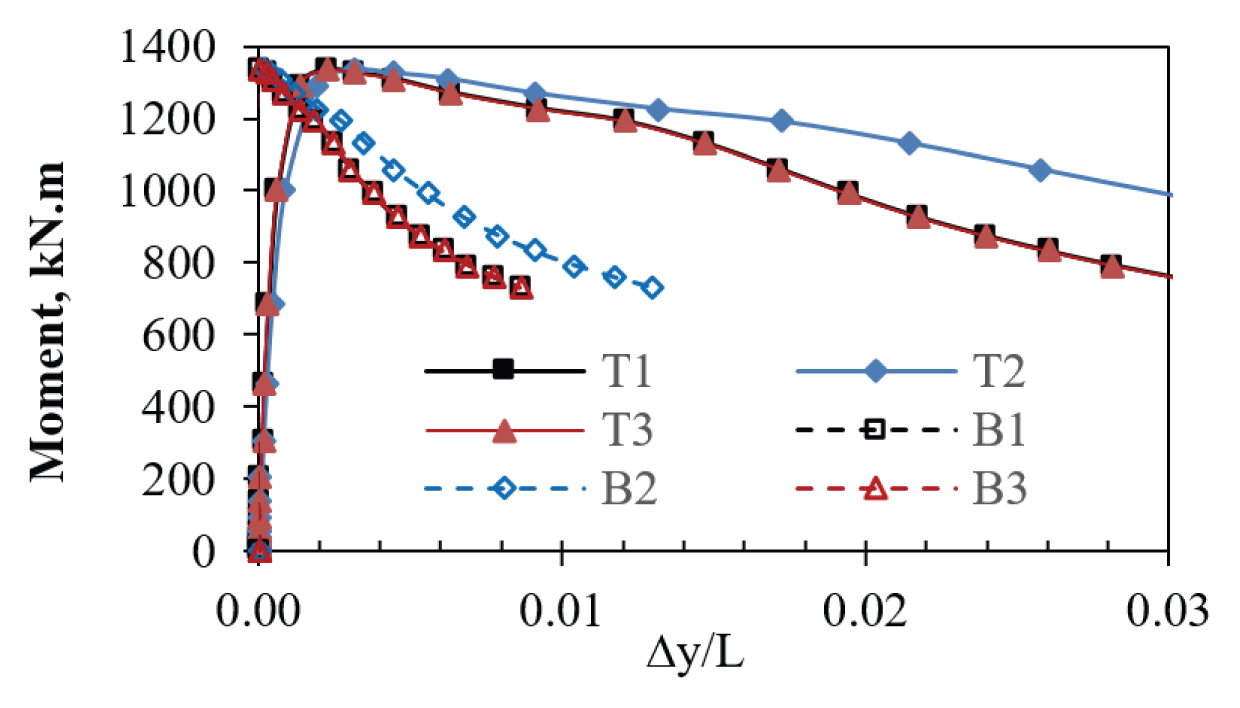
Load–deformation Curve at 20°C with a Length of 7 m
Load–deformation Curve at 600°C with a Length of 7m in all Cases
3.2 Flexural strength ratio at elevated temperature and buckling mode shape
Fig. 12 illustrates the reduction ratio of the critical load from the inelastic buckling analysis for the six elevated temperature scenarios. The simulated data were plotted as the ratio of the critical flexural strength at elevated temperature (MT℃) and at ambient temperature (M20℃) with respect to the unbraced length.
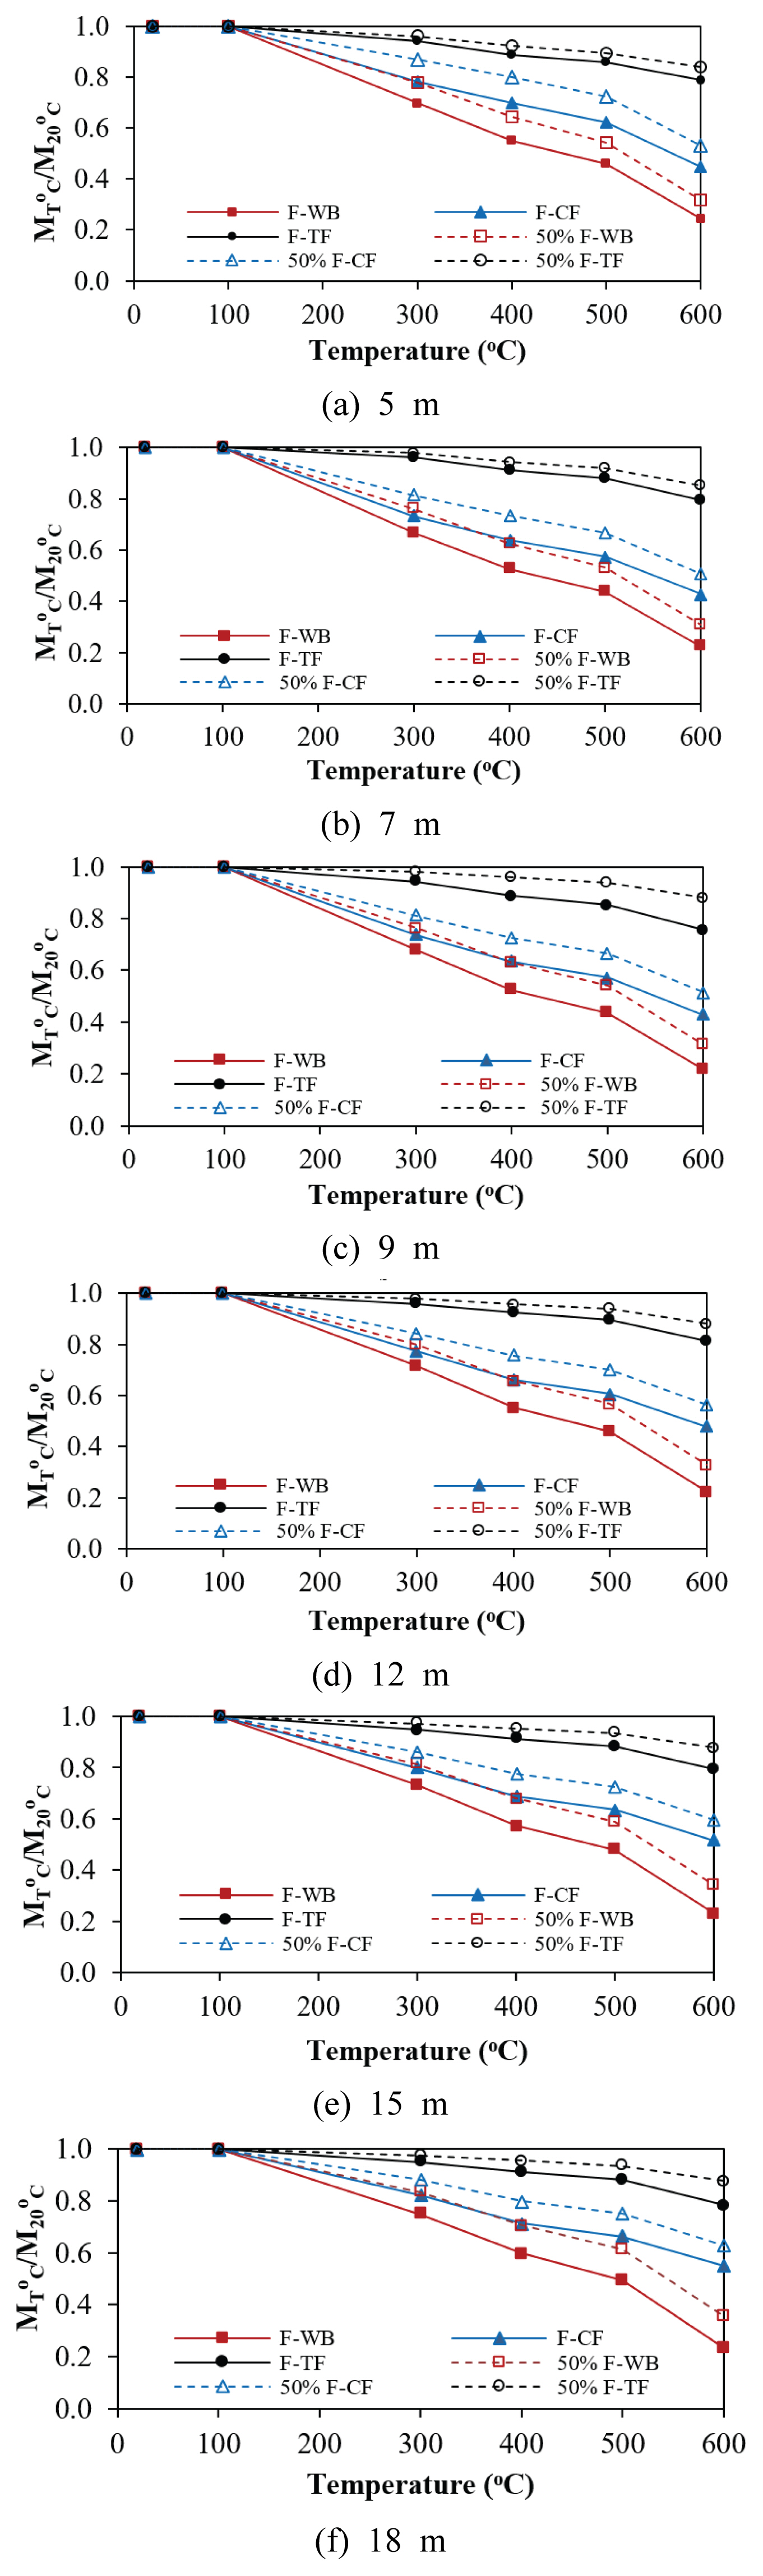
Reduction Ratio in the Inelastic Buckling Strength
The analyzed beams with a lengths from 5m to 18m showed variations in the reduction of the flexural strength based on the temperature exposure area. The expected behavior was observed at F-WB, demonstrating fastest decrease in strength when the whole beam is heated. The strength degrades to approximately 52% to 60% at 400℃, and 22% to 24% at 600℃. While the least critical scenario was observed at case of F-TF and 50%F-TF. At 600℃, the flexural strength decreased to between 76% and 81% for F-TF, and 84% and 88% for 50%F-TF.
At 50%F-WB and F-CF, the reduction in flexural strength was relatively similar at lower temperature. However, as the temperature exceeds 400℃, 50%F-WB showed a greater decrease in strength than F-CF. The flexural strength decreased to at least 63% for both cases at 400℃. While at 600℃, the flexural strength was down to approximately 31% to 36% for 50%F-WB, and 43% to 55% for F-CF. Lastly, at 50%F-CF, the flexural strength gradually decreased to 73% to 80% in strength at 400℃ and 51% to 60% at 600℃.
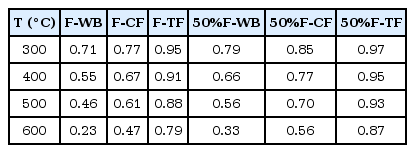
The average reduction ratio are summarized in Table 1 For cases of partially elevated temperature in compression components, F-CF and 50%F-CF, the reduction in flexural strength was the lowest. At 600℃, the flexural strength decreased by an average of about 53% and 44%, respectively. In cases of partially elevated temperature in tension components, F-TF and 50%F-TF, the reduction in flexural strength decreased slowly. At 600℃, the flexural strength decreased by an average of about 21% and 13%, respectively. In cases of F-WB and 50%F-WB, the reduction in flexural buckling strength was the highest. At 600℃, the flexural strength decreased by an average of about 77% and 67%, respectively.
The Average Reduction Ratio
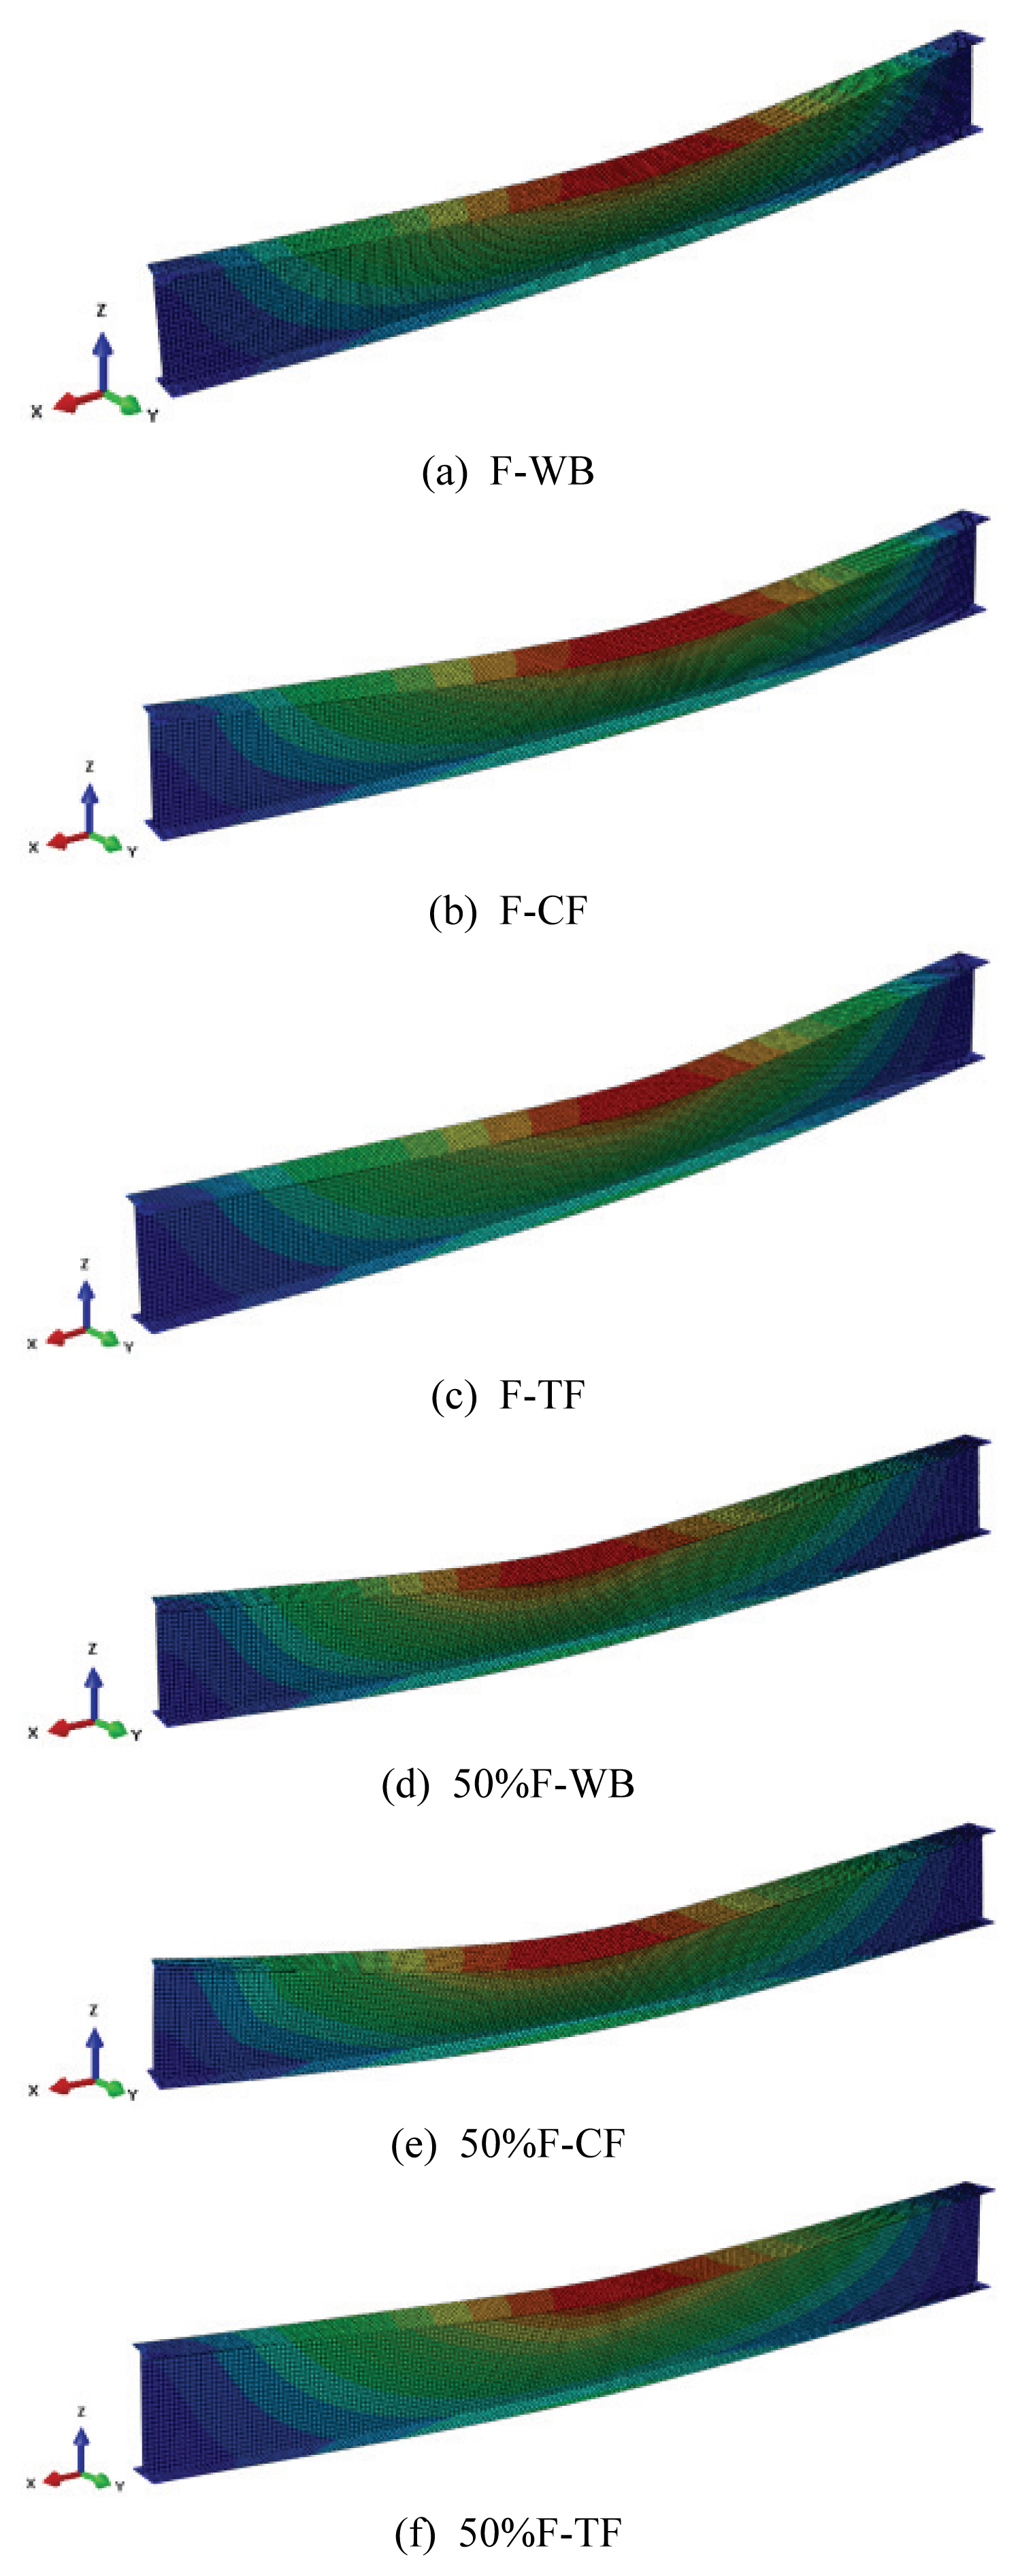
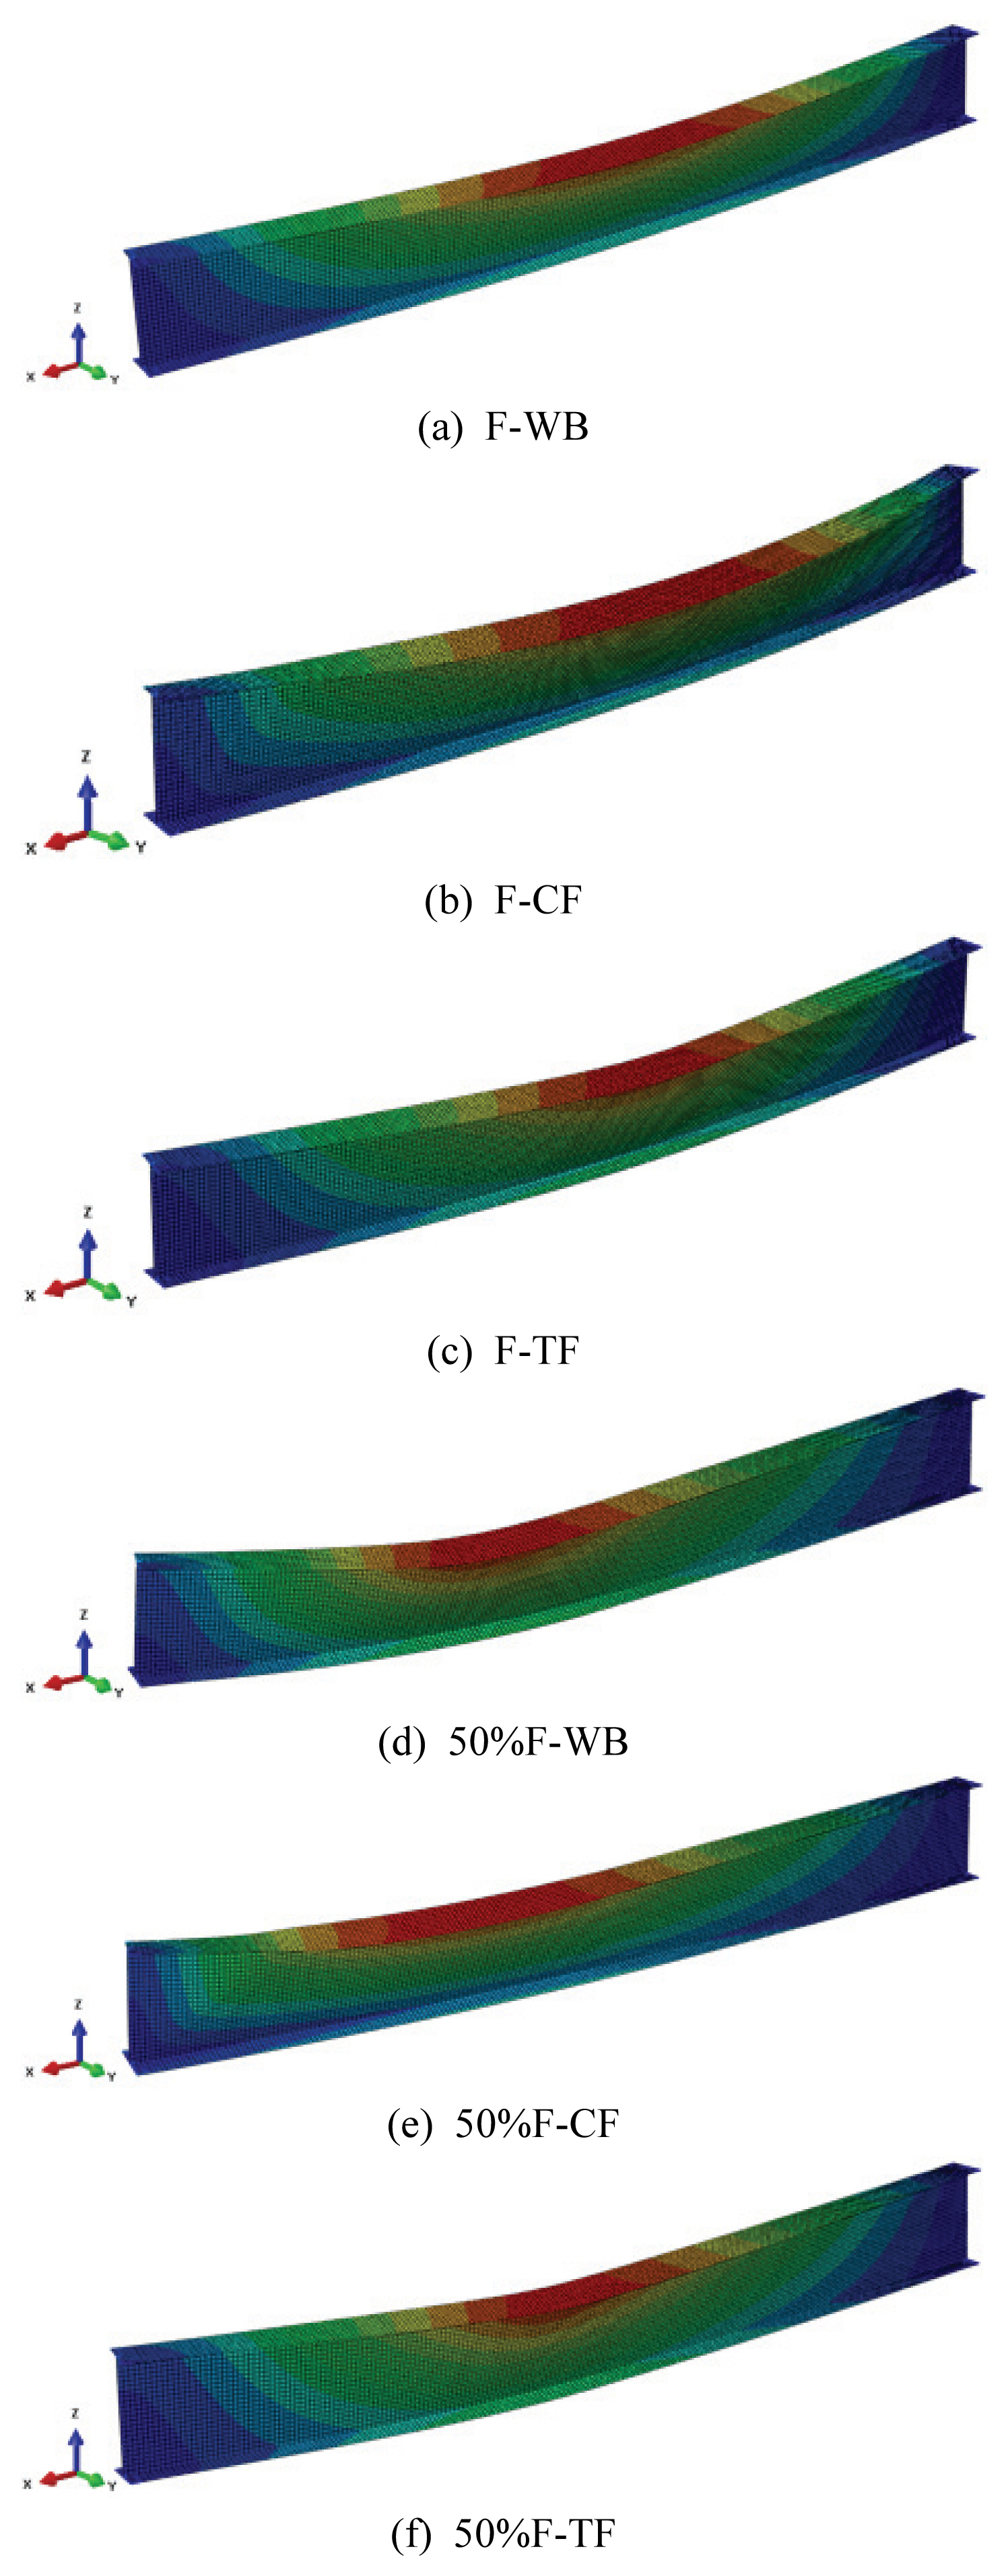
Figs. 13 and 14 show the inelastic buckling mode shapes of the beam models with unbraced length of 7 m exposed to temperatures of 300℃ and 600℃. The buckling occurred at the center of the beams for F-WB, F-CF, F-TF, and 50%F-TF illustrating the location of the critical point. In addition, the buckling was observed to occur at the center of the beam at 300℃ for cases 50%F-WB and 50%F-CF but changes the location of the critical point near the heated area at 600℃. At 300℃, the yield strength of steel does not change and the elastic modulus decreases to 80% of its ambient temperature values. While at 600℃, the yield strength decreases about half of its ambient temperature value, and the elastic modulus decreases more rapidly about 30% of its ambient values. Therefore, at 600℃ the beam at the heated area will be weaker than the non-heated area of the beam that leads to buckling point near the heated area.
Buckling Mode Shape of the Beam with a Length of 7 m at 300°C
Buckling Mode Shape of the Beam with a Length of 7 m at 600°C
4. Conclusions
The inelastic buckling behavior of steel beams at elevated was investigated through finite element analysis. According to the results, the flexural strengths of steel beams decreased rapidly when the compression components and the whole beam are exposed to elevated temperature. While the tension components gave the least effect on the strength degradation of beams. Therefore, the greater the exposed area of the compression component to elevated temperature, the larger the amount of reduction in flexural buckling strength.
In this study, the elevated temperature was subjected to several parts of the beam such as half and throughout the beam, compression flange, and tension flange. It shows that steel structures are sensitive and vulnerable to elevated temperature that can lead to structural collapse. It is then recommended to investigate the buckling behaviour at elevated temperature and fire resistant performance of steel structures reinforced with protective coating materials.
Acknowledgements
This research was supported by a 2019 Research Grant from Sangmyung University.