들녘단위 농업용수 물수급 분석을 위한 EPA-SWMM 변조제어기법 적용
Application of EPA-SWMM with Modulated Controls for Agricultural Water Balance Analysis
Article information
Abstract
최근 봄철 가뭄으로 인해 관개기 이전에 충분한 용수를 확보하지 못하여 농업용수 공급에 어려움을 겪고 있으며, 최적 시기에 최적량의 농업용수를 배분하는 효율적인 물관리의 중요성이 대두되고 있다. 따라서, 분수문 및 제수문 등 농업수리시설의 관리방안 개선, 농업용수 공급 및 균등 분배를 위한 물공급 모형을 활용한 최적의 물관리 방안 구축이 요구된다. 본 연구에서는 수로 네트워크를 적용하고 수리학적 용수공급 모의가 가능한 EPA-SWMM (United States Environmental Protection Agency Storm Water Management Model)의 변조제어기법(Modulated Controls)을 농업용수 물수급 분석에 적용하였다. 변조제어기법은 시설별 시계열 곡선의 공급량, 개도율 설정을 통해 연속관개, 간단관개 및 윤환관개 모의가 가능하며, 포장에 대한 담수심 상태를 기준으로 급수 및 배수를 조절하므로 시기별 관리수심을 고려한 모의 분석이 가능하다. 안성 고삼저수지를 대상으로 실제 물관리 방법을 반영한 EPA-SWMM 변조제어기법을 적용하여 들녘단위 농업용수 공급 모의 및 관개효율을 분석하였으며,용수 부족 또는 과잉 공급이 나타나는 지역을 파악하기 위해 수로간선별 수혜면적별 담수율 및 공급량을 분석하였다. 담수율 분석을 통해 안택 지선 하류부에 용수부족이 나타난 것을 확인하였으며, 공급량에 대한 정량적 분석결과 수문조절을 통한 공급량 조절이 필요할 것으로 판단된다. 본 연구의 관개효율 분석 결과는 농업용수가 부족한 가뭄 시 관개조직의 합리적인 용수공급 효율 평가와 농업용수 공급 방법에 대한 사전 분석을 통한 효율적인 물 관리에 기여할 것으로 판단된다.
Trans Abstract
Due to the recent spring drought, it has been difficult to supply agricultural water owing to an insufficient water supply before irrigation, thereby illuminating the importance of efficient water management for allocating optimal agricultural water amounts. Thus, improved management plans for irrigation facilities are required as well as an optimal water management plan for agricultural water supplies and equitable distribution. In this study, we applied modulated controls to the EPA-SWMM and analyzed the agricultural water supply and demand. The EPA-SWMM simulates the hydrological water supply and can be applied to a water supply network. Modulated controls can simulate continuous, intermittent, and rotational irrigation methods by setting the supply time series, and adjusting the water supply and drainage based on ponding depth conditions in the paddy field. We applied the EPA-SWMM with modulated controls to Gosam reservoir in Anseong to analyze the agricultural water supply and irrigation efficiency. The water supply via canals and irrigated areas was analyzed to identify areas of water shortages or oversupply. According to the results of a quantitative water supply analysis, we determined that it is necessary to control the water supply using gate opening rate controls. The results obtained herein can contribute to efficient water management by evaluating the efficiency of irrigation organizations during a drought when insufficient agricultural water is available via preliminary analysis of agricultural water supply methods.
1. 서 론
지구 온난화와 극심한 기후변화로 자연재해 빈도가 증가하고 있으며(Zhang and Zhou, 2015; Yoon et al., 2022), 경제적, 환경적, 사회적 피해를 발생시키는 가뭄의 강도 및 발생 빈도가 증가하는 추세이다(Wilhite et al., 2000; Yoon et al., 2020; Shin et al., 2021). 또한, 기상재해 위험 증가로 인한 농업용수 부족현상이 빈번하게 발생하여 농업용수의 안정적 공급과 관리의 어려움을 겪고 있다(Nam et al., 2015; Bang et al., 2020; Lee et al., 2020). 이에 따라 최근 정부에서는 지속 가능한 통합 물관리 실현을 위해 물관리 효율성을 강조하고 있다(Park et al., 2020; Kim et al., 2022).
농업용 저수지 물관리 방법은 저수지마다 물관리자에 따라 다르며, 현재 물관리 방법은 주로 물관리자의 경험에 따라 이루어지고 있어 용수의 과다 손실과 균등분배에 어려움이 발생한다(Nam et al., 2013). 또한, 농민들의 요청 시 용수공급이 이루어져 합리적인 물관리에 한계가 있다. 따라서, 효율적인 물관리, 합리적인 분배, 말단 수로 및 포장까지 안정적인 용수공급을 위해 공급량에 대한 정량적인 분석 및 관개효율 평가와 공급량 및 수문 조절을 통한 합리적인 물관리 방안 구축을 위한 연구가 필수적이다.
EPA-SWMM (United States Environmental Protection Agency Storm Water Management Model) 모델은 주로 도시유역의 강우 유출 특성 분석에 활용되었으며(Choi and Ball, 2002; Javier et al., 2006; Barco et al., 2008; Lee and Yeon, 2008; Kang et al., 2012; Kim et al., 2012, Lee and Choi, 2015; Koo and Seo, 2017), 최근 농업분야의 개수로를 통한 물배분 모의에 활용되고 있다. 저수지, 오리피스, 펌프 등으로 구성된 수로 네트워크를 부정류 흐름으로 해석하여 수리해석 모듈에 따른 용수공급 모의가 가능하며(An et al., 2022), 효율적인 농업용수 관개를 위한 용수 공급체계 및 수로 네트워크를 활용한 평야부의 물 배분 모의 분석에 활용되고 있다(Kang et al., 2013; Nam et al., 2016; Park, 2017; Bang, 2019; Shin, Nam, Bang, Kim, An, and Lee, 2020; Shin, Nam, Bang, Kim, An, Do et al., 2020). 최근 SWMM 모델을 활용하여 농업용수 분배 모의 및 공급량, 관개량 및 배수량을 활용한 간선별, 수혜면적별 관개효율을 분석하고, 평야부 관개효율 및 용수공급 취약성을 평가한 연구가 진행되었다(Shin, Nam, Bang, Kim, An, and Lee, 2020; Shin, Nam, Bang, Kim, An, Do et al., 2020). 선행연구에서는 수혜면적 약 500 ha인 수원공 공급체계가 단순한 저수지를 대상으로 용수공급 모의 및 관개효율 분석 연구를 수행하였다.
본 연구에서는 수혜면적 약 3,000 ha인 수원공 및 보조수원공 공급체계가 복잡한 지구를 대상으로 하였으며, 수원공 공급량, 분수문 및 제수문의 개도율 제어와 증발산량, 침투량, 강수량의 필지별 적용이 가능한 EPA-SWMM 변조제어기법을 활용하여 현장 상황을 반영한 수로 네트워크 모의를 하고자 한다. EPA-SWMM 모의결과를 활용하여 용수공급 현황을 파악을 위한 담수율 평가 및 공급량에 대한 정량적 분석 기반 용수부족지역을 구분하고자 한다.
2. 재료 및 방법
2.1 대상 저수지
연구 대상지는 수로 네트워크 구축을 위한 기초자료인 용수계통도 구축이 되어있으며, 보조수원공으로 양수장 및 취입보가 포함된 저수지로 들녘단위 분석이 가능한 경기도 안성시에 위치한 고삼저수지를 대상으로 하였다. Fig. 1과 Table 1은 각각 대상 저수지의 수혜구역 및 간선위치와 제원을 나타낸 것이다. 고삼저수지는 1963년 준공된 유효저수량 15,217천 m3으로 단위저수량 5.1천 m3/ha, 유역면적 7,100 ha, 수혜면적 2,969.8 ha, 10년 한발빈도 규모로 설계되었다. 또한, 용수계통도는 220개의 필지와 22개의 간선 및 55개의 지선으로 구성되어 있으며, 양수장 13개 및 취입보 3개의 보조수원공을 통해 추가 용수공급을 받고 있다.
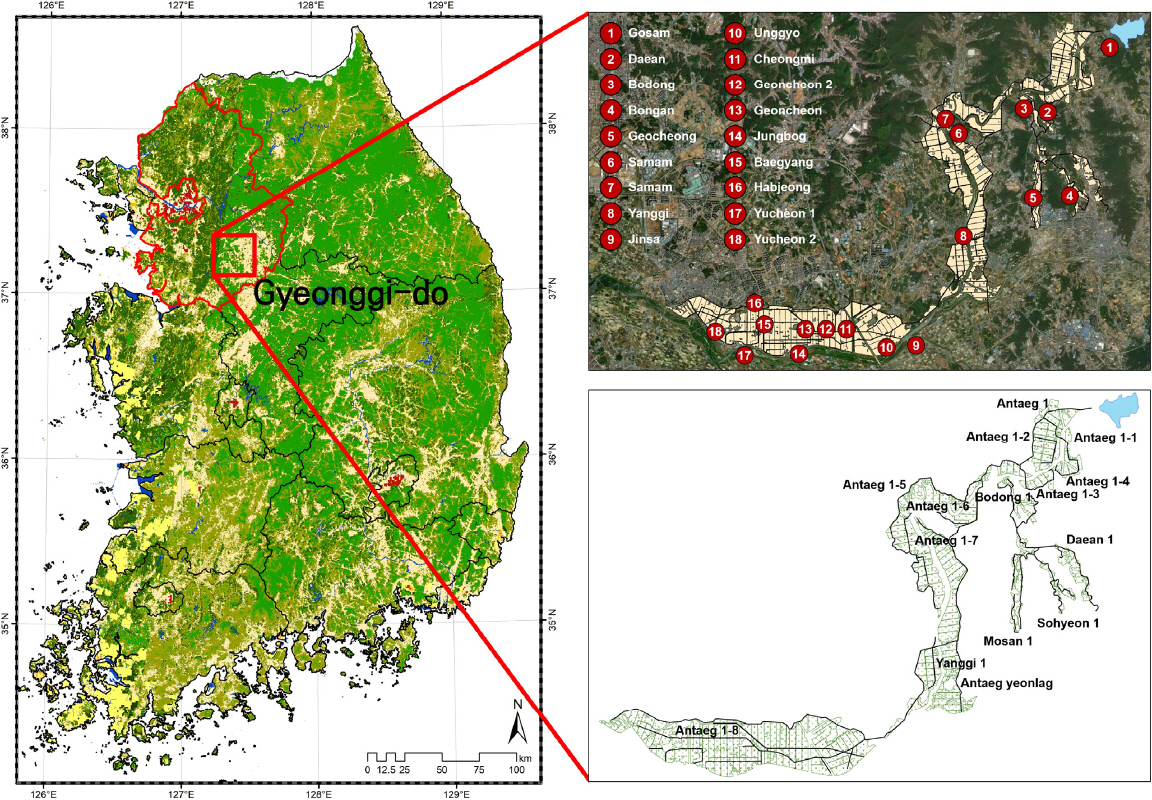
Location of Intake Works, Irrigated Areas and Irrigation Canals in Gosam Reservoir, Gyeonggi-do

Characteristics of the Agricultural Reservoir and Irrigation Area Used in Gosam Reservoir
본 연구에서는 농업용수 공급현황 파악을 위한 EPA-SWMM 모델 기반 수로 네트워크 모의를 하고자 시점부 한국농어촌공사의 수로 수위자료를 활용였다. 농업용 저수지 공급 모의에 대한 EPA-SWMM 모델의 적용성 검증 후 변조제어기법을 활용하여, 담수율로부터 용수공급현황을 통해 용수 부족 지역을 구분하였다.
2.2 EPA-SWMM
EPA-SWMM은 미국 환경부(Environmental Protection Agency, EPA)의 지원과 Metcalf & Eddy 사, 미국 플로리다 대학 및 Water Resources Engineers (WRE) 사 등의 공동연구로 1970년대 초반에 개발된 강우-유출 해석 모델이다(Choi and Choi, 2015). 개수로, 관수로, 취입보 등 농업용수로의 형상을 고려함으로써 개수로 위주인 농업용수 모의가 가능하다(Rossman, 2017). 하나의 유출구로 흐르는 형태의 네트워크 체계로 구성된 우수하수 모의 체계를 역방향으로 분석하여 하나의 수원공에서 간선 및 지선, 지거 용수로를 통해 각 필지에 용수가 배분되는 수로 네트워크 체계를 통해 농업용수 공급 모의를 하였다(Shin, Nam, Bang, Kim, An, Do et al., 2020). EPA-SWMM 모델링을 위하여 스마트팜맵, 연속수치지형도 등 디지털 공간자료를 수집한 후 영농조사 및 현장조사를 바탕으로 최신화된 용배수계통도와 수혜면적 자료를 활용하여 EPA-SWMM 기반 수로 네트워크를 구축하였다.
물 공급현황 파악과 용수부족지역 구분을 위해 필지별 관리수심에 대한 일 담수심 비율 기반 담수율(EPD)을 평가하였으며, 산정식은 Eq. (1)과 같다. Table 2는 담수율 평가 범례를 나타낸 것이다.

Classification of the Percentage of Days the Ponding Depth is Reached
Eq. (1)에서 PDf는 포장담수심(mm), PDset은 관리수심(mm)을 의미한다.
2.3 변조제어기법
변조제어(modulated controls)는 시간경과, 포장의 수심 및 수원공의 상태 값에 따라 SWMM의 공급(pump) 및 유량조절(flow regulator) 객체를 제어하는 방법으로, EPA-SWMM을 이용한 농업용수 공급모의 시 분석기간동안 수원공의 공급조절, 분수문 및 제수문의 개폐조절, 포장으로의 급수 및 배수 물꼬 개폐조절 적용이 가능하다(Jung, 2021). 또한, 시계열 곡선의 공급량, 개도율 설정을 통해 연속, 간단, 윤환관개 모의 및 포장에 대한 담수심 상태를 기준으로 급수 및 배수를 조절하므로 시기별 관리수심을 고려한 모의가 가능하며, 모의기간 동안 일별 작성이 아닌 담수심 관리기간 단위로 조건문을 작성하므로 모의시간 및 계산시간 단축이 가능하다.
본 연구에서는 EPA-SWMM 변조제어기법을 활용하여 현장 물관리 방법을 반영한 수원공 공급량 조절, 수문제어 등을 통해 필지단위 담수심, 공급량, 관개량 및 배수량과 간선별 유입량, 배수량, 용수도달시간 등을 활용하여 관개효율 및 용수공급 흐름을 파악하였다.
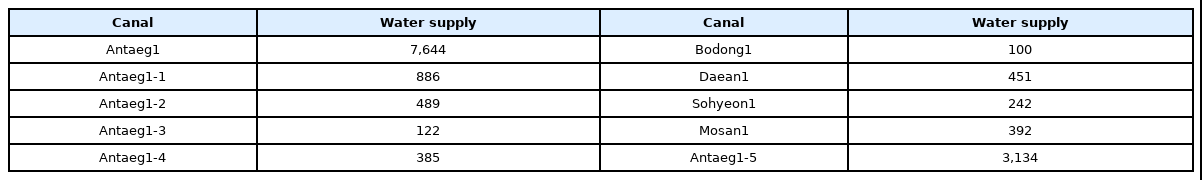
모의기간은 2017년부터 2020년까지 관개기 5월 1일부터 9월 10일까지 대상으로 하였다. 관리수심은 영농방식 및 생육단계에 따른 물관리 방법을 참고하여 적용하였으며, Table 3은 관개기간별 담수심을 나타낸 것이다. 수원공 및 보조수원공의 공급량의 경우 단위용수량을 활용하여 적용하였으며, Table 4는 고삼저수지 수원공 및 보조수원공의 공급량을 나타낸 것이다. 간이양수장인 봉안양수장은 소규모시설이므로 공급량을 적용하지 않았다.
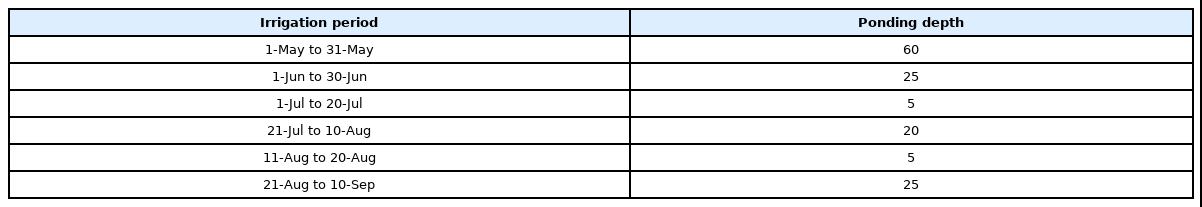
Ponding Depth in Irrigation Period
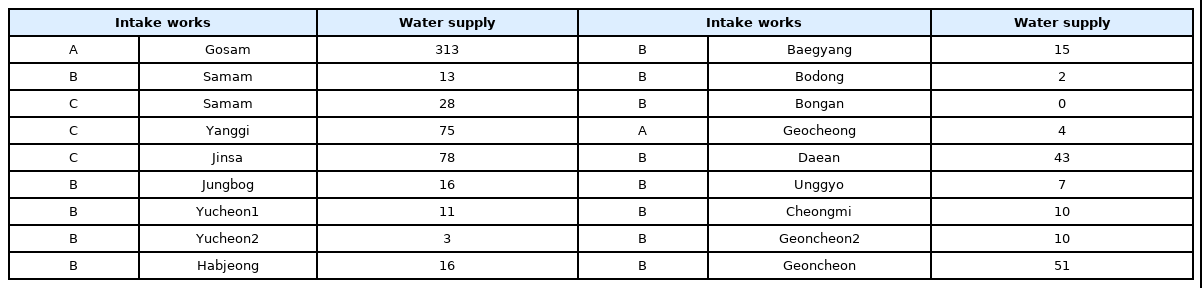
Water Supply in Reservoir, Pumping Station and Weir
수원공 및 보조수원공의 운영조건은 4시부터 18시까지 14시간 가동하는 것으로 설정하였다. 증발산량은 기온, 일조시간, 습도 및 풍속 등의 기상데이터로 잠재증발산량을 산정하는 데 적합하고, 주간과 야간의 기상상태의 차이를 고려한 조정계수를 도입한 수정 Penman 식(Doorenbos and Pruitt, 1977)을 활용하여 일 단위 증발산량을 적용하였다. 기상자료는 기상청에서 제공하는 종관기상관측장비(Automated Surface Observing System, ASOS)를 통해 수집하였으며, 기상관측소는 대상 저수지 인근에 위치한 이천 관측소로 선정하였다. 침투량은 농업생산기반정비사업계획기준 관개편(MAF, 1998)에서 제안한 평균 침투량 4 mm/day를 적용하였다.
3. 연구 결과
3.1 EPA-SWMM 적용성 평가
농업용 저수지 공급 모의 시 EPA-SWMM 모델의 적용성을 파악하기 위해 고삼저수지 2018년 6월부터 9월까지 시점부 수로수위 실측 데이터와 모의결과 데이터를 비교하였으며, Fig. 2는 고삼저수지의 시점부 수로수위 실측 및 모의값 비교결과를 나타낸 것이다. 모의결과 수로수위 데이터가 실제 용수공급 시기와 유사한 경향이 나타났다. 모델 평가를 위해 Nash-Sutcliffe Efficiency (NSE)를 활용하였으며, NSE 값이 0.79로 통계분석 결과가 유의한 수준인 것으로 판단된다. 이를 통해 농업용 저수지 공급 모의 시 EPA-SWMM 모델 활용에 대한 적용성을 확인하였다.

Comparison of Observed and Simulated Levels of Irrigation Canals
3.2 담수율 평가
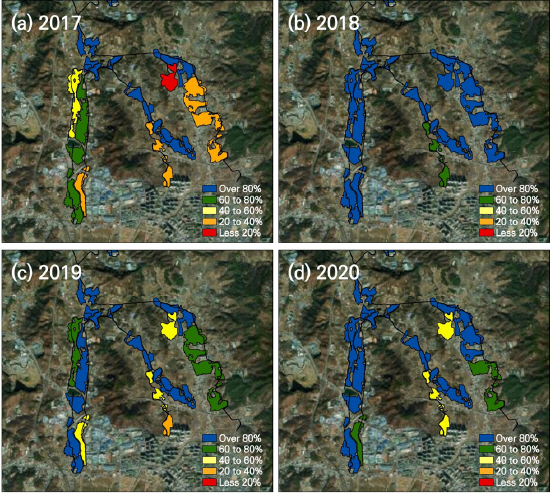
용수공급현황 파악을 위해 담수율 분석을 하였으며, Figs. 3과 4는 각각 2017년부터 2020년까지 전체 수혜구역의 담수율 분석결과와 안택1-3지선 하류부의 담수율 분석결과를 나타낸 것이다. 분석기간 동안 대체적으로 80% 이상의 용수공급이 적정하게 이루어진 것으로 나타났으며, 대안양수장 수혜구역인 안택1-3지선 하류부 대안1지선, 모산1지선, 소현1지선의 경우 2018년을 제외하고 모두 담수율 40% 미만으로 나타났다. 특히, 2017년 담수율 20% 미만으로 가장 낮은 관개효율이 나타났다. 용수 부족을 겪는 지역의 경우 수문제어 기반 공급량 조절이 필요한 것으로 판단된다.
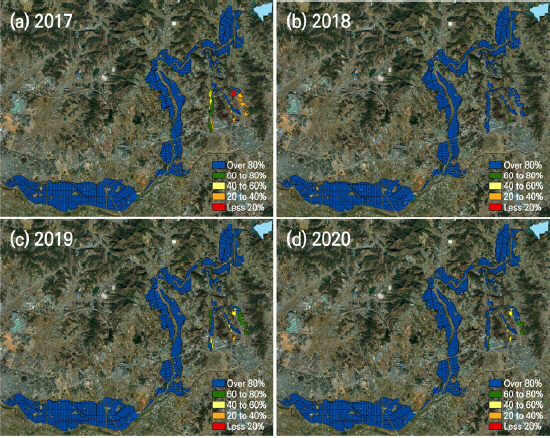
Results of Simulation on the Supply of Agricultural Water Using EPA-SWMM
Results of Simulation on the Supply of Agricultural Water Using EPA-SWMM in Antaeg 1-3 Downstream
3.3 공급량 분석
담수율 분석을 통해 용수부족지역을 구분한 후 공급량 분석을 하고자 하였으며, Fig. 5는 2017년부터 2020년까지 안택1-3지선 공급량을 나타낸 것이다. 안택1-3지선의 연별 공급량 비교결과 2017년 1,987천 m3로 가장 적은 양의 물이 공급되었으며, 2018년 2,647천 m3로 가장 많은 양의 물이 공급되었다.
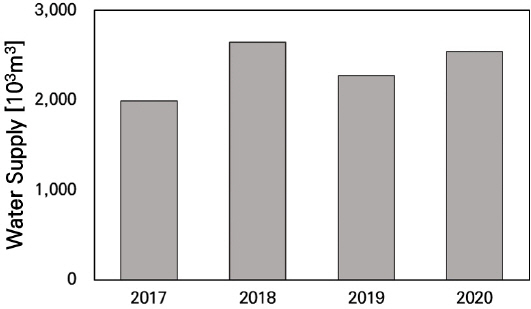
Comparison of Annual Water Supply of Antaeg 1-3 Canal in Gosam Reservoir
Table 5는 고삼저수지 간선별 수혜면적 비율과 2017년부터 2020년까지 간선별 공급률을 나타낸 것이다. 안택1-3지선에 면적대비 적은 양의 물이 공급되는 것으로 나타났으며, 안택1간선과 안택1-8지선에 면적대비 많은 양의 물이 공급되는 것으로 나타났다. 따라서, 안택1간선과 안택1-8지선의 수문제어를 통해 공급량을 조절하여 안택1-3지선에 용수공급을 한다면 효율적인 물관리가 가능할 것으로 판단된다.

Comparison of Area Ratio by Canals and Annual Water Supply Ratio in Gosam Reservoir
3.4 간선별 공급량 분석
용수부족지역을 파악하고자 2018년 관개기 5월부터 9월을 대상으로 간선별 공급량 대비 수혜면적 비율을 통해 원단위 공급량 분석을 하였다. Fig. 6은 2018년 5월부터 9월까지 고삼저수지 간선별 원단위 공급량을 나타낸 것이며, 강수시기와 용수공급시기가 유사한 것으로 판단된다.
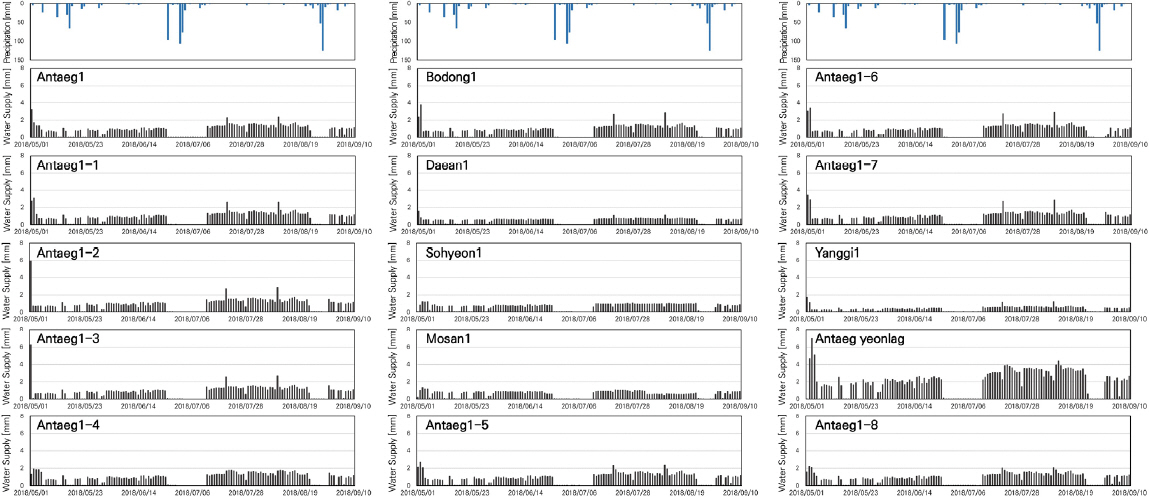
Comparison of Unit Water Supply by Canal in Gosam Reservoir in Irrigation Period
Table 6은 2018년 관개기의 간선별 평균 원단위 공급량을 나타낸 것이며, 안택연락간선 2,627 mm으로 가장 많은 물의 양이 공급되었다. 대안1지선 654 mm, 소현1지선 843 mm, 모산1지선 801 mm 그리고 양기1호지선 494 mm으로 용수부족이 나타났다. 안택연락간선의 경우 안택1간선에서 분수 된 간선으로 말단부에서 하천으로 방류되어 금광저수지 수혜구역에 공급하는 구역으로 현장 물관리 방안을 적용한 모의결과, 가장 많은 양의 물이 공급된 것으로 판단된다. 대안1, 소현1, 모산1지선의 경우 안택1-3지선에서 취수하여 공급하는 대안양수장의 수혜구역으로 충분한 물의 양을 취수하지 못하여 적은 양의 물이 공급된 것으로 판단되며, 안택1-3지선 수문제어를 통한 공급량 조절이 필요할 것으로 판단된다. 양기1호지선의 경우 한천 말단부에 위치한 양기취입보의 수혜구역으로 말단부에 위치하여 충분한 양의 용수공급이 어려운 것으로 판단되며, 안택1간선 하류부로 이어지는 수문제어를 통한 물관리가 필요한 것으로 판단된다.
Comparison of Unit Water Supply by Canal in Gosam Reservoir
4. 결 론
본 연구에서는 고삼저수지를 대상으로 농업용수 공급현황 파악 및 용수부족지역 구분을 하고자 변조제어기법을 적용하여 EPA-SWMM 모델 기반 수로 네트워크 모의를 수행하였다. 시점부 수로수위 실측 데이터를 기준으로 모의 데이터와 비교하여 농업용수 공급 모의 시 EPA-SWMM 모델의 적용성을 확인하였으며, 담수율 및 간선별 공급량 분석을 하였다.
2017년부터 2020년까지 관개기를 대상으로 담수율 분석결과 하류부의 경우 담수율 80% 이상으로 용수공급이 적정하게 이루어진 것으로 나타났다. 상류부에 위치한 안택1-3지선 하류부의 경우 담수율 40% 이하로 용수 부족이 나타난 것을 확인하였다. 고삼저수지 간선별 공급량에 대한 정량적 분석결과 2017년 1,987천 m3으로 가장 적은 양의 물이 공급되었으며, 2018년 2,647천 m3으로 가장 많은 양의 물이 공급되었다. 간선별 수혜면적 비율과 공급률 비교분석 결과 안택1-3지선에 면적대비 적은 양의 물이 공급되는 것으로 나타났으며, 안택1간선과 안택1-8지선 수문제어 기반 공급량 조절이 필요할 것으로 판단된다.
본 연구의 경우 단일 저수지를 대상으로 하였기 때문에 여러 수원공들이 복잡하게 얽혀있는 유역기반의 복합 저수지를 분석하기 위해서는 EPA-SWMM 모델을 활용한 농업용수 공급 모의 및 결과검증에 대한 추가적인 연구가 필요할 것으로 판단된다.
본 연구 결과는 물 부족 지역과 용수 과잉공급지역을 파악하여 물관리 담당자에게 상세한 현행 용수공급량 및 용수공급체계 정보 제공이 가능할 것으로 판단되며, 향후 효율적인 물관리 방안 구축을 위한 기초자료로 활용 가능할 것으로 사료된다.
감사의 글
본 연구는 농림축산식품부의 재원으로 농림식품기술기획평가원의 농업기반 및 재해대응 기술개발사업의 지원(121033-3)에 의해 수행되었습니다.