AHP를 적용한 Euclidean Distance 기반 재난안전사업 예산 투자우선순위 산정
Investment Priorities of the Budgets for Disaster and Safety Management Projects Based on Euclidean Distance with AHP
Article information
Abstract
본 연구의 목적은 재난 및 안전관리 사업 예산의 투자 효율성을 강화하기 위하여 재난⋅사고 유형 간 투자우선순위를 산정하는 것이다. 이를 위해 분석대상은 재난안전예산 분류체계에 따른 43개 유형 중 피해 통계자료(2014-2018) 수집이 가능한 35개 유형으로 한정하였다. 분석요소는 (ⅰ) 재난 및 안전사고 피해현황: 연평균 발생건수, 사망자수, 재산피해, (ⅱ) 대형재난 발생특징: 발생주기, 건당 사망자수, 건당 재산피해이다. 분석방법은 각종 재난과 안전사고로 인한 피해현황의 규모를 종합적으로 나타내고자 AHP (Analytical Hierarchy Process)를 적용하여 분석요소의 가중치를 산출하고, 유클리드 거리(Euclidean Distance)에 의하여 최종 순위를 도출하였다. 분석결과, 투자우선순위가 높은 유형은 자연재난에서 풍수해, 폭염, 대설 및 한파 등으로 나타났다. 사회재난 및 안전사고에서는 선박 재난⋅사고, 감염병, 자살, 화재⋅폭발, 안전취약계층 사고 등의 순이었다. 투자우선순위가 높은 재난⋅사고 유형은 중점투자유형으로 선정하여, 피해저감 및 예방을 위한 집중적인 관리가 필요하다.
Trans Abstract
The object of this study is to determine investment priorities for various types of disasters and accidents in order to promote the investment efficiency of disaster and safety management budgets. To this end, data were collected on 35 types of disasters and accidents and damage statistics for the five most recent years (2014-2018) from 43 disaster and safety management projects budgets. Factors are (i) the damage status of overall disasters and accidents: annual average number of occurrences, human casualties, and property losses, and (ⅱ) the characteristics of large-scale events: occurrence cycle, human casualties per disaster, and property losses per disaster. Investment priority was determined using Euclidean distance with weights determined by the AHP (Analytical Hierarchy Process) to represent the current status of damage caused by disasters and accidents. As a result, storm⋅flood and maritime accidents were found to have greatest investment priority. Heat waves, heavy snows (including cold waves), infectious diseases, suicides, fires (including explosions), and accidents in vulnerable social groups show a higher ranking of investment priority. Massive investment in disaster and safety management focusing on these types is necessary.
1. 서 론
「재난 및 안전관리 기본법」 제10조의2에 근거하여 ‘재난안전예산 사전협의’ 제도가 시행되고 있다. 이 제도는 정부 전체 재난 및 안전관리 사업 예산(이하, 재난안전예산)의 체계적인 관리와 효과성⋅효율성 제고를 위하여, 2015년(2016년 예산안, 2014년 세월호 사고 이후) 처음 신설되어 현재까지 시행되고 있다. 행정안전부는 각 부처로부터 제출받은 중기사업계획을 기초로 하여 재난안전관리 사업의 투자방향, 우선순위의견 등을 검토하고, 투자등급을 확정한다. 그 결과는 중앙안전관리위원회 심의(위원장: 국무총리)를 거친 후 기획재정부에 통보하고, 기획재정부는 사전협의(안)을 반영하여 예산을 편성하게 된다(MOIS, 2020a).
2020년 기준, 2021년 재난안전예산 사전협의 대상은 410개 사업으로(R&D 제외), 그 규모는 16.8조에 이른다(MOIS, 2020a). 이러한 재난안전예산은 풍수해, 화재⋅폭발 등 43개 유형(자연재난 9개, 사회재난 및 안전사고 27개, 공통 8개)으로 분류되고 있다(MOIS, 2020b; Table 3 참조). 유형별로 대표적인 재난안전사업은 다음과 같다. 풍수해 관련 ‘기상 레이더 운영’(기상청, 2018년 사업비 94억), 선박사고 인명피해 저감을 위한 ‘수색구조 역량강화’(해경청, 55억), 안전취약계층 사고 대응을 위한 ‘독거노인⋅중중장애인 응급안전알림서비스’(복지부, 100억), 구조⋅구급 및 응급의료 ‘응급처치 활성화 지원’(복지부, 33억), 안전문화 및 교육⋅훈련⋅홍보 ‘국민 안전의식 선진화’(행안부, 36억) 등이다(MOIS, 2019a).

Source of Damage Statistical Data According to Classification of Disaster and Safety Management Projects Budget
재난 및 사고를 예방하고, 국민의 인명과 재산손실을 막기 위하여 정부는 수많은 사업을 수행하고 있으며, 이에 따라 방대한 예산이 투입된다. 이러한 재난안전예산의 효율적인 운용과 투자 방향성을 제시하고자, 행정안전부는 매년 재난안전예산 사전협의 관련 중점투자가 필요한 유형을 선정하고 투자방향을 제시하고 있다(MOIS, 2020a). 이를 뒷받침하기 위해 국립재난안전연구원은 피해현황, 이슈강도, 발생가능성 등 다양한 지표를 활용하여, 재난안전예산 중점투자유형 선정(안)을 마련하였다(NDMI, 2018; 2019; 2020).
NDMI (2019)에 따르면 중점투자유형을 선정하기 위한 여러 지표 중에서 ‘피해현황’이 가장 중요한 것로 나타난다. 3가지 지표 중 피해현황의 가중치는 0.5176으로, 나머지 두 지표의 가중치를 합한 것보다 큰 것으로 확인된다(사회적 이슈강도 0.1729, 발생가능성 0.3095). 재난안전예산 중점투자유형 선정 시, 재난⋅사고의 피해현황을 면밀히 파악하여 인명 및 재산피해 등 피해규모가 큰 유형을 식별하는 것이 필요하다(Cho and Choi, 2018; 2019).
본 연구의 목적은 정부의 한정된 재난안전예산을 보다 효과적이며 효율적으로 투자하기 위하여, 집중적인 재난안전관리가 필요한 재난⋅사고 유형을 도출하는 것이다. 이를 위해 재난⋅사고의 발생현황과 피해 규모를 정량화하여, 다양한 재난 및 안전사고 유형 간 재난안전예산 투자우선순위를 산출하였다. 재난과 안전사고 전반적인 피해현황 및 대형재난 사례 등 유형별 통계자료를 수집하였고, AHP와 Euclidean distance (이하 유클리드 거리)를 활용하여 투자우선순위를 분석하였다. 도출된 연구결과를 통해 재난 및 안전사고의 발생과 피해규모가 큰 유형을 구분할 수 있었다. 이는 재난안전예산 중점투자유형 선정(안)으로 활용 가능하며, 또한 이를 바탕으로 재난안전예산의 투자 방향성을 제시할 수 있다.
2. 연구동향
재난과 사고로 인한 예방과 대비를 위하여 재난관리에 대하여 다수의 연구가 수행되었다. 영국, 네덜란드 등에서는 National Risk Assessment (NRA)를 수행하여 국가 재난관리 투자우선순위를 파악하고, 이용가능한 자원 배분의 최적화를 도모하고 있다(OECD, 2016). 또한 영국에서는 National Risk Register (NRR)를 발행하여, 향후 5년 이내에 발생가능한 위험요인을 식별하고 이에 대처하고 있다. 이 보고서는 발생가능성 등 위험요인에 대한 정보 및 이에 대비하는 방법 등을 제공하고 있다(U.K Cabinet Office, 2017). 캐나다에서 자연재난 등으로 인한 비상상황 대처 계획 수립을 위하여 All Hazard Risk Assessment (AHRA)를 개발하여 활용하고 있다(Public Safety Canada, 2013).
2015년 재난안전예산 사전협의 제도 시행 이후, 국내에서 재난안전예산의 효율성 및 효과성 제고를 위한 연구가 진행되어왔다. 사업별 투자우선순위 판단기준을 마련하고, 사전협의 제도에 대한 개선방안을 제시하였다(KIPA, 2015; 2016; 2017). 또한 우선순위 산정 시 중점투자유형을 선정하고 중점투자유형에 해당하는 사업에 가점을 부여하지만, 가점의 비중이 낮아 실효성이 적다는 지적이 있었다(NABO, 2017). 그러나 다양한 재난⋅사고 유형 중 중점투자유형을 선정하는 기준이나 절차는 제시되지 않았다.
재난⋅사고의 위험성을 평가하고(NEMA, 2011; Choi et al., 2017), 유형 간 우선순위 분석 및 중점투자유형을 분석한 연구가 일부 수행되었다(Lee et al., 2016; Kim et al., 2018; Cho and Choi, 2019). 또한 지역의 안전관리를 위하여 유형 간 중요도를 결정하고, 우선관리대상을 선정하는 연구가 진행되었다(Song and Lee, 2012; Lee et al., 2015; Kim et al., 2019). 그러나 대부분의 선행연구는 자연재난 또는 홍수, 일부 사회재난(도로교통사고, 화재, 붕괴 등)을 대상으로 분석하거나 지역의 안전관리를 위하여 유형 간 우선순위를 도출하여, 국가차원에서 관리되는 다양한 재난⋅사고를 다루지는 않아 재난안전예산 중점투자유형 선정을 위한 근거자료로 활용하는데 어려움이 있었다.
이에 Cho and Choi (2018)는 자연재난의 ‘지역안전도’ (NEMA, 2011) 및 사회재난 분야 ‘재난위해지수(Lee et al., 2016)’의 유클리드 거리를 활용하고, 국가차원에서 관리하고 있는 35종의 재난과 사고로 확장하여 재난⋅사고 유형별 피해현황에 대한 ‘위험순위’를 산출하였다. 그러나 피해현황의 규모를 나타내는 위험순위 산출 시 분석요소의 가중치를 동일하게 적용하였다는 한계점이 있었다. 피해현황을 나타내는 분석요소별 중요도는 각기 다르게 나타나고, 이러한 가중치에 따라 우선순위는 변동가능성이 있다.
따라서 본 연구에서는 Cho and Choi (2018)의 유클리드 거리에 기반을 둔 위험순위를 활용하고, 위와 같은 한계점을 개선하고자 전문가 대상 AHP를 실시하여 가중치를 결정하였다. 이를 통해 국가적으로 관리하고 있는 재난 및 안전사고를 대상으로, 재난⋅사고의 발생현황 및 피해 규모를 정량화하여 보다 명확하고 객관적인 재난안전예산 투자우선순위를 도출하고자 하였다(Table 1).

Difference Compared with Related Studies
이를 통해 한정되어 있는 재난 및 안전관리 예산의 투자 효율성 제고를 위해서 집중적인 재난안전관리가 필요한 중점투자 분야를 선정하는데 도움을 줄 수 있다.
3. 연구방법 및 자료
본 연구는 국내에서 발생하는 재난⋅사고의 피해현황을 정량화하기 위하여 Lee et al. (2016) 및 Cho and Choi (2018)의 유클리드 거리를 활용하였다. 단, 피해현황을 나타내는 분석요소 간 중요도 반영하고자 AHP를 활용하여 가중치를 분석하였다.
본 연구절차는 Fig. 1과 같다. 먼저 수정 유클리드 거리를 정의하고, 가중치 결정을 위한 AHP 분석, 피해 통계자료 수집, 재난⋅사고 유형별 재난안전예산 투자우선순위를 결정한다.
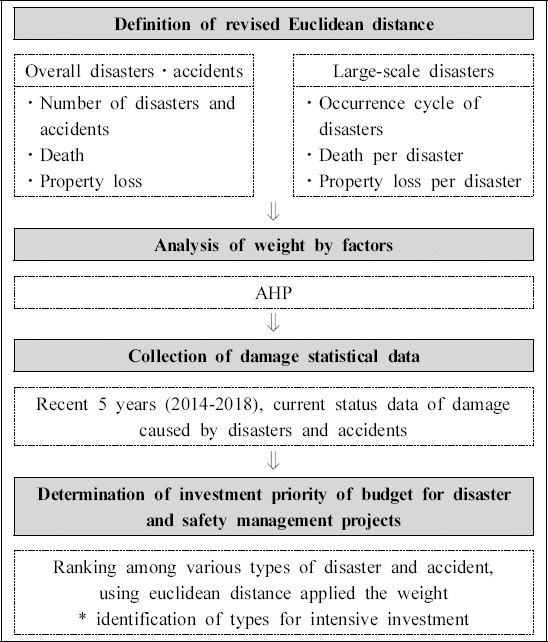
Procedure for Determining Investment Priority
3.1 수정 유클리드 거리 정의
3.1.1 유클리드 거리
유클리드 거리는 2차원 평면 또는 3차원 공간의 두 점의 거리를 계산하는 방법이다. 의사결정을 위한 인자가 여러 개이며, 다양한 대안이 있는 경우 다양한 인자를 종합적으로 평가하여 적정한 대안을 선택하기 위해 활용되는 거리척도기법(Distance Measurement Method, DMM) 중 하나이다(NEMA, 2011; Song and Lee, 2012; Cho and Choi, 2018).
Fig. 2와 같이 피해현황을 나타내는 여러 가지 인자(발생건수 = a, 인명피해 = b, 재산피해 = c)의 값을 각각 최대값은 ‘1’로 정하고, 이에 대비하여 수치를 변환(anor(i), bnor(i), cnor(i))한다. 이 값을 3차원 공간좌표상에 표출하고 ‘0’에서부터 거리를 측정한다. 유클리드 거리(Di)는 Eq. (1) (Lee et al., 2016) 또는 Eqs. (2)와 (3)을 통하여 계산한다(Song and Lee, 2012).
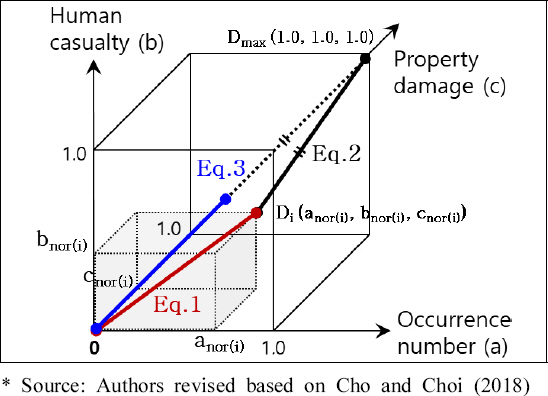
Euclidean Distance
i= 재난 및 안전사고 유형,
이때 계산된 값이 ‘0’에 가까울수록 비교적 안전하며, 반대로 값이 클수록 위험이 크다고 해석한다(Lee et al., 2016).
3.1.2 수정 유클리드 거리
본 연구에서 재난⋅사고 피해현황을 유클리드 거리로 나타내어, 유형별 상대적인 비교를 통해 투자우선순위를 결정하였다. 피해현황 규모 정량화를 위한 분석요소는 Cho and Choi (2018)와 같이 (ⅰ) 재난과 사고의 전체적인 피해현황, (ⅱ) 대규모 피해가 발생한 재난 사례1)이다. 두 가지 분석요소는 각각 1개의 발생현황, 2개의 피해(인명피해, 재산피해)로 구성되어 있다.
위와 같은 분석요소는 재난과 안전사고의 전반적인 피해현황 파악 및 수준 측정을 위하여 직접적인 피해에 초점을 맞춘 것으로, 다양한 재난⋅사고에 대하여 공통적으로 수집가능한 피해 통계자료로만 한정된다(Cho and Choi, 2018).
상기 기술된 6개의 세부 분석요소를 Table 2와 같이 정리할 수 있다. 발생현황(a)는 연평균 재난⋅사고 전체 발생건수(a1)와 대형재난 발생주기(a2)로 구성된다. 또한 인명피해(b)는 연평균 재난⋅사고 전체 사망자 수(b1)와 재난 1건당 사망자수(b2)로 이루어져 있고, 재산피해(c)는 연평균 재난⋅사고 전체 재산피해(c1)와 재난 1건당 재산피해(c2)를 포함한다.

Analysis Factors
이러한 분석요소는 다음과 같은 특징을 나타낸다. 첫째, 연간 국내에서 발생하는 크고 작은 사고와 재난을 모두 포함하는 유형별 발생건수와 피해현황의 총량을 고려할 수 있다. 둘째, 전체 재난⋅사고의 발생건수, 사망자, 재산피해만을 합산하여 결과를 산출하면, 절대적으로 피해현황의 통계량이 적은 재난⋅사고 유형에 대한 중요도는 우선순위에서 상대적으로 낮게 산출된다. 이러한 한계점을 개선하고자 대형재난 사례(특별재난지역 선포, 지역 및 중앙 재난대책본부 운영)를 추가하여, 1건의 사고로 다수의 피해가 발생한 경우를 추가적으로 반영하였다. 단, 대형재난의 피해현황(발생건수, 인명피해, 재산피해)은 재난⋅사고 전체에 일정부분 반영되어 있어, 이를 중복으로 산정하지 않기 위하여 대형재난의 특성(발생주기와 건당 사망자 및 건당 재산피해)을 산정하여 활용하였다(Cho and Choi, 2018).
Eqs. (2), (3)과 세부 분석요소를 고려하여 수정된 유틀리드 거리(Di′)를 Eq. 4와 같이 정의하였다. 6개의 분석요소를 각각 두 개의 특성( (ⅰ) 재난과 사고 전체, (ⅱ) 대규모 재난 피해)으로 통합하여 3개의 요소를 만들었고, 3차원 공간상에 분포시킨 후 0에서 부터의 거리를 측정한다. 이때 Eq. (1)에 의하면 특정한 인자의 값이 크면 유클리드 거리가 크게 도출된다. 이를 보완하여, 여러 인자가 적정하게 큰 값을 가질 때 그 결과값이 크게 산출되는 Eqs. (2), (3)을 적용하였다(Song and Lee, 2012; Cho and Choi, 2018). 여기서 유클리드 거리의 결과값은 다양한 분석요소의 중요도에 따라 영향을 받게 된다. 따라서 분석요소 간 가중치를 결정하기 위하여 전문가 대상 설문조사를 기반으로, AHP 분석을 수행하였다.
여기서, i= 재난 및 안전사고 유형, 분석요소(a1nor(i), a2nor(i), b1nor(i), b2nor(i), c1nor(i), c2nor(i))는 정규화 단계를 거친 값임.
wa1 + wa2 + wb1 + wb2 + wc1 + wc2 = 1
a1nor(i) = 재난⋅사고 발생건수 정규화 값, a2nor(i) = 대형재난 발생주기 정규화 값
b1nor(i) = 재난⋅사고 사망자수 정규화 값, b2nor(i) = 대형재난 건당 사망자수 정규화 값
c1nor(i) = 재난⋅사고 재산피해 정규화 값, c2nor(i) = 대형재난 건당 재산피해 정규화 값
3.2 분석요소 간 가중치 도출
3.2.1 AHP
AHP (Analytical Hierarchy Process, 계층화분석법)는 의사결정문제가 여러 가지 평가 기준으로 이루어져 있는 경우, 단계별로 계층화하여 중요도(Weight)를 결정하는 방법론이다(Lee et al., 2015). 이 기법은 1970년대 초 Thomas. Saaty가 처음으로 고안한 의사결정 방법론으로, 의사결정자의 오랜 경험이나 전문성을 바탕으로 요소 간 중요도를 결정한다(Lee et al., 2002). 각 계층에서 다양한 요소의 중요도를 서로 상대적으로 비교하여 측정한다. 단계별로 평가된 중요도를 종합함으로써, 최종적으로 최하위 계층에 있는 여러 가지 대안에 대한 가중치와 우선순위를 도출할 수 있다(Kim et al., 2015).
AHP는 다양한 분야에서 정책적 의사결정에 사용되었다. 재난⋅사고 간 우선순위 산정(Lee et al., 2015; Kim et al., 2019)과 재해구호지원센터 설치방안(Lee and Shin, 2019)에 활용되었으며, 국가 R&D 투자우선순위 파악(Lee et al., 2002; Lee et al., 2020), 환경 및 주거문제 해결(Kim et al., 2013; Foroughi and Rasol, 2016), 관광 활성화(Lee and Lee, 2015), 물류산업 발전(Jung and Kim, 2013; Yoon et al., 2016), 마리나 항만 안전관리(Kim et al., 2015) 등의 분야에서 연구가 수행되어 왔다.
AHP 분석절차는 구체적으로 다음의 4단계를 거친다(Kim et al., 2015). 첫째, 목표 및 의사결정 요소 도출과 계층분석 모델 설정한다. 평가목표를 정의하고 및 평가항목 도출하는 단계이다. 목표달성을 위해 도출된 평가요소를 계층화(level)하고 의사결정모델 구축한다.
둘째, 쌍대비교를 통한 요소들 상호 평가한다. 각 의사결정 요소들이 얼마나 중요한지 또는 선호되는지를 일대일 쌍대비교(paired comparisons method) 평가를 수행한다. 평가된 값을 이원비교행렬로 구축한다(Eq. (5)). 행렬 A의 최대고유값 (λmax)에 대한 고유벡터를 산출하고, 정규화를 통해 가중치 산정한다(Eq. (6)).
셋째, 평가 참여자의 판단에 대한 논리적 일관성을 검증한다. 이를 위해서는 일관성 지수(C.I., consistency index) 및 일관성 비율(C.R., consistency ratio)을 이용한다(Eqs. (7), (8)).
C.I.는 응답자의 응답결과가 일관될수록 작은 값으로 산출된다. 산출된 C.I.를 R.I. (Random Index)로 나누어 C.R.을 계산한다. 여기서 일관성의 여부는 ‘0.1’ 이하이면 유효하다고 판단한다(Saaty, 1987; Saaty, 1990).
마지막으로, 계층별 평가요소 간 쌍대비교를 통해 얻은 평가 결과를 통합하여 평가요소의 최종 중요도를 도출한다. 대안 간 가중치와 우선순위를 파악한다.
3.2.2 분석요소 간 가중치
본 연구에서 분석요소 간 가중치를 산정하기 위한 AHP 구조는 Fig. 3과 같이 2개의 계층으로 구축하였다. 설문조사지는 9점 척도로 설계하였다. ‘1’은 비교 대상의 중요도가 동등하다는 것을 의미한다. 숫자가 커질수록 중요도가 크다고 평가하며, 최대 9점으로 평가한다.
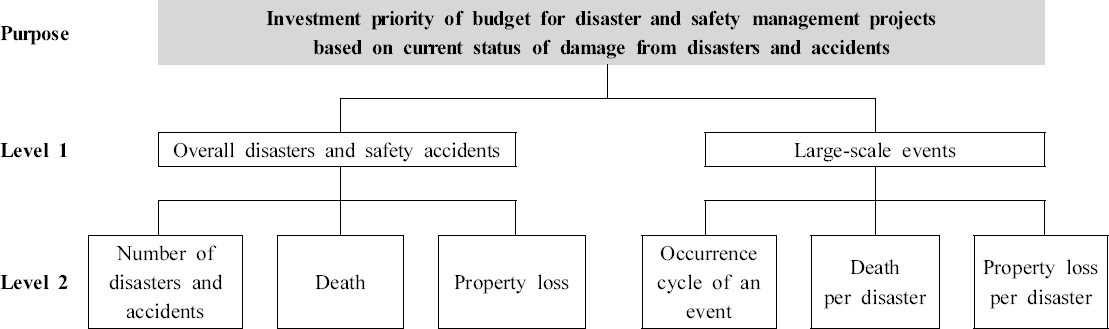
AHP Structure of Determining Investment Priority
본 연구에서는 AHP의 쌍대비교 평가는 전문가 대상 서면 설문조사(e-mail)를 계획하였다. 전문가는 재난안전관리 분야 연구 유경험자 및 관련 업무 종사자를 대상으로 하였다. 재난안전 관련 연구기관(정부 출연기관, 대학교) 및 실무기관(부처⋅공공기관), 관련 민간기업 등 509명에게 배포하였다.
3.3 피해 통계자료
3.3.1 재난 및 사고 전체 피해현황
본 연구의 분석자료는 Cho and Choi (2018; 2019)를 참조하였다. Table 3과 같이 다양한 관련 부처별⋅기관별이 생산하는 재난⋅사고의 피해현황을 나타내는 통계자료로, 이를 통해 재난 및 안전사고의 발생과 인명⋅재산피해에 대한 전반적인 현황 파악이 가능하다(Cho and Choi, 2018; 2019).
피해 통계자료는 최근 5년간 구축을 원칙으로 하였으며, 단기적인 측면의 현황을 고려하였다. Table 4와 같이 2014년부터 2018년까지 5년간 통계자료를 수집하였다. 재난안전사업⋅예산 분류체계(2021년도 재난안전예산 사전협의안부터 적용, MOIS, 2020b)에 따라 전체 43개 중에서 35개의 재난⋅사고 유형에 대한 발생건수⋅횟수 등 발생현황과 사망⋅부상 등 인명피해, 재산피해액을 수집하였다. 일부 유형은 통계 확보의 한계로 제외되었다: 자연재난 1개(낙뢰 등 기타), 사회재난 1개(전시재난⋅테러), 공통 6개(안전문화 및 교육⋅훈련⋅홍보, 구조⋅구급 및 응급의료, 재난 구호 및 복구, 재난안전 관리체계, 해외재난 관리, 교부세 및 기타).
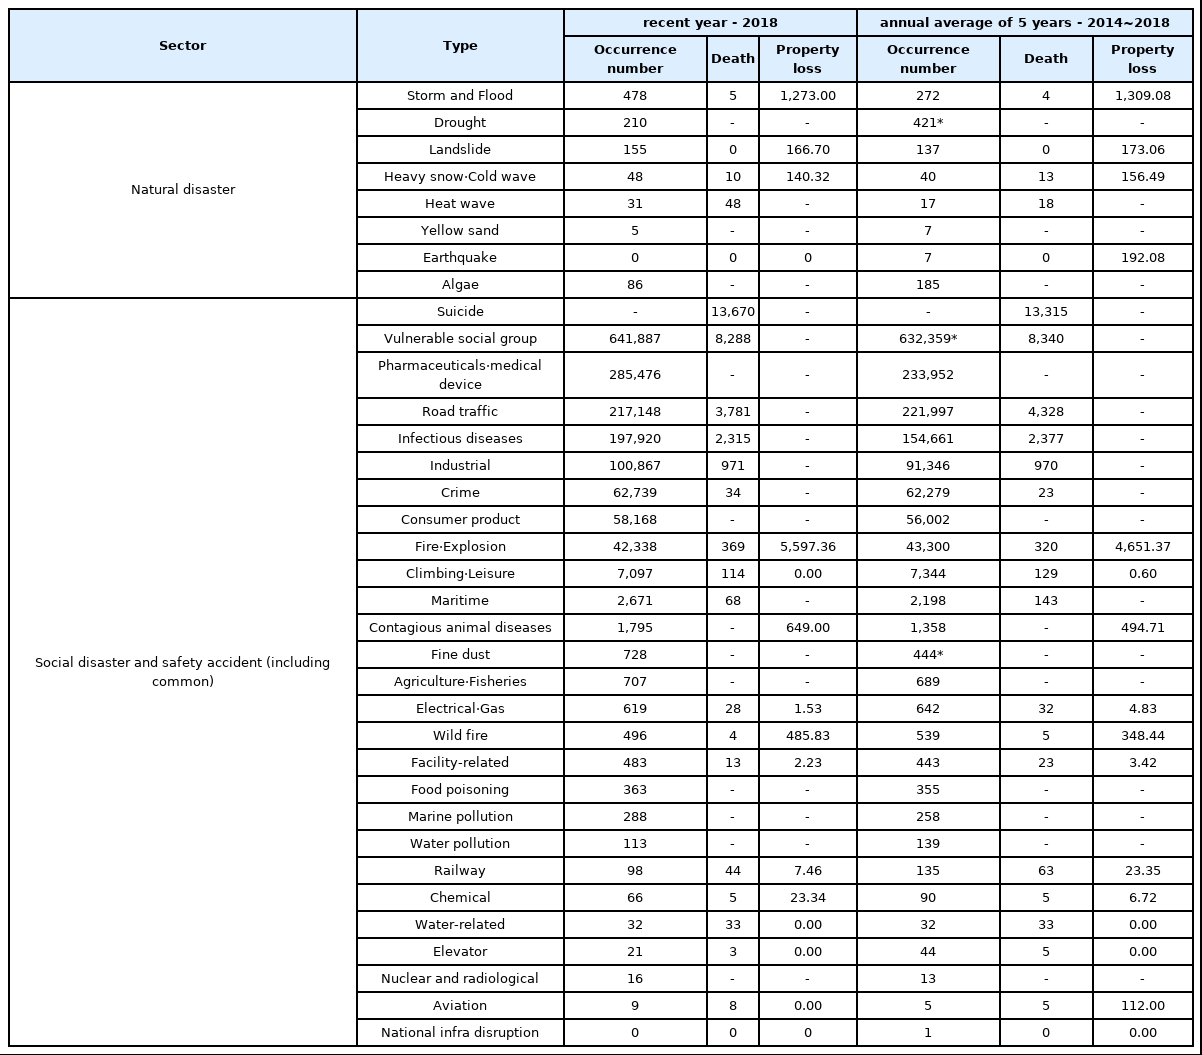
Current Status of Damage Caused by Disasters and Accidents unit: cases, people, one hundred million won
그러나 일부 유형은 실제 피해가 발생하나, 국가 공식통계에서 재산피해액이 집계되지 않고 있었다(가뭄, 폭염, 교통사고, 선박 재난⋅사고 등). 향후 이러한 한계점은 추가적인 데이터 발굴 또는 전문가 조사를 통하여 보완해야 할 것이다. 또한 인명피해 중 사망자뿐만 아니라 많은 부상자가 발생하거나(폭염, 한파, 교통사고, 등산⋅레저사고, 범죄 등), 사망자는 없지만 다수의 부상자가 발생(식품사고)하는 유형이 있다. 따라서 사망자 이외 부상자를 고려하는 방안이 필요하다 판단된다.
3.3.2 대형재난 사례
본 연구에서 대형재난이란 1건의 사건(event)으로 인하여 대규모 인명, 재산, 사회적 이슈 및 파급력 등의 피해가 발생한 사건으로, 해당 사건의 당사자 및 관련 기관의 역량을 넘어 지역정부 및 중앙부처가 개입하여 대처⋅수습한 사례로 정하였다(Cho and Choi, 2018; 2019). 이러한 대규모 피해가 발생한 재난의 자료는 Cho and Choi (2018; 2019)에서 참조하였다. 대형재난 사례의 해당범위는 다음과 같다. 자연재난은 재해연보에서 제공하는 특별재난지역 선포 사례의 피해현황을 추출하였다(MOIS, 2019b). 사회재난은 재난연감에 나타나 있는 지역 또는 중앙 재난안전대책본부(시/군/구 재난안전대책본부, 시/도 재난안전대책본부, 중앙사고수습본부(중수본), 중앙재난안전대책본부(중대본))가 운영된 경우로만 한정하였다(MOIS, 2019c).
본 연구의 목적은 재난안전예산 투자방향 수립과 관련하여 중점투자가 필요한 유형을 선정하고자, 재난⋅사고 유형 간 투자우선순위를 도출하는 것이다.
중점투자유형은 매년 선정하고 있어, 최신의 피해양상을 고려하고자 최근 5년간 통계자료로 한정하여 단기적인 측면에서 분석을 수행하였다.
대형재난의 피해 통계자료의 수집기간은 재난⋅사고 전체 피해현황과 같이 2014년부터 2018년까지이다(MOIS, 2019a; 2019b). Table 5와 같이 5년간 대형재난 사례를 수집하였으며, 이를 바탕으로 발생주기, 건당 인명피해 및 재산피해를 산정하여 Table 6에 정리하였다(산정방법은 3.1.2 참조).

Current Status of Damage Caused by Large-Scale Disasters unit: cases, people, one hundred million won

Occurrence Cycle and Damage Caused by Large-Scale Disasters unit: year/an event, people/a case, one hundred million won/a case
본 연구에서는 단기적인 측면의 피해현황을 분석하였다는 한계점이 존재한다. 특히 대형재난의 발생주기의 경우 최근 5년간 자료를 이용하여 5년 이상의 주기가 산정될 수 없는 문제가 있었다. 따라서 향후에는 분석자료의 기간을 확장하여 재난의 발생 특징을 명확하게 도출하여야 할 것이다.
4. 분석결과
4.1 가중치 분석
4.1.1 설문조사 기초분석
설문조사는 2019년 10월 14일부터 25일까지, 2주 동안 e-mail을 통하여 서면으로 실시하였다. 재난 및 안전관리 관련 경력이 있는 다양한 재난⋅사고 분야의 전문가 509명에게 배포하였으며, 이 중 회수된 설문지는 174건이었다.
설문조사에 응답한 전문가의 소속은 대학교 61명(35.1%), 정부기관⋅정부출연 연구원 및 지역 연구원 54명(31.0%), 민간기업 26명(14.9%), 실무 부처⋅지역 공무원 및 공공기관 소속 25명(14.4%)의 순으로 나타났다(Table 7). 또한 전문가의 평균 연구⋅근무경력은 20.0년(근속연수 미표기 2명 제외 산출평균 값)이었다(Table 8).

Work Characteristics of Experts Replied Survey

Career Characteristics of Experts Replied Survey
4.1.2 분석요소 간 가중치
응답한 설문지 174건 중 AHP 평가에 대한 미성실 응답(중복응답⋅미응답 등) 7건은 제외하고, 167건에 대하여 분석을 수행하였다. 167건에 대하여 건별로 일관성을 검토하였다.
이 중 level 1, 2 모두 C.R. 기준치 ‘0.1’ 이하인(Saaty, 1987; Saaty, 1990) 답변만 추출하여, 논리적 일관성이 유효한 57건을 확보하였다. C.R.은 level 1에서 ‘0.0000’이며, level 2에서 ‘0.0309’로 논리적 신뢰성은 타당하다(Table 9).

Result of Consistency
분석요소 간 가중치의 분석결과는 Table 10과 같다. Level 1에서 대형재난의 가중치는 ‘0.6270’으로, 재난⋅사고 전체 ‘0.3730’보다 약 2배 더 높은 가중치를 나타내는 것으로 분석되었다. Level 2에서 대형재난과 재난⋅사고 전체에서 각각 건당 인명피해와 인명피해 합계가 가장 높게 평가되었다. 최종적으로 대형재난 건당 인명피해의 가중치가 ‘0.3273’로 6개의 세부요소 중 중요도가 가장 높게 평가되었다. 그 다음으로 재난⋅사고 전체 인명피해(0.2040), 대형재난 건당 재산피해(0.1556), 대형재난 발생주기(0.1441), 재난사고 전체 재산피해(0.0942), 재난사고 전체 발생건수(0.0748) 순으로 나타났다.
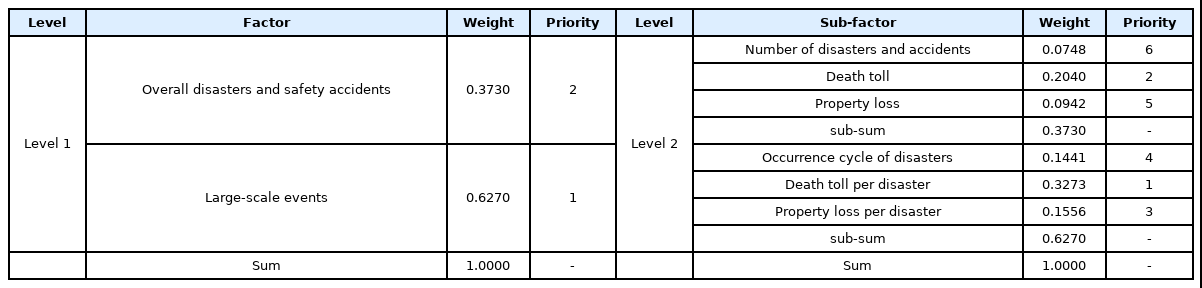
Weight by Factors of Determining Investment Priority
전문가 평가는 피해현황 분석요소 중 대형재난이 매우 중요한 것으로 나타났다. 세부적으로는 대형재난 발생 시 건당 인명피해와 연간 발생하는 재난⋅사고 인명피해 등의 가중치가 높게 나타나는 것으로 확인되었다.
4.2 재난안전예산 투자우선순위 결정
4.2.1 재난⋅사고 유형별 유클리드 거리 산출
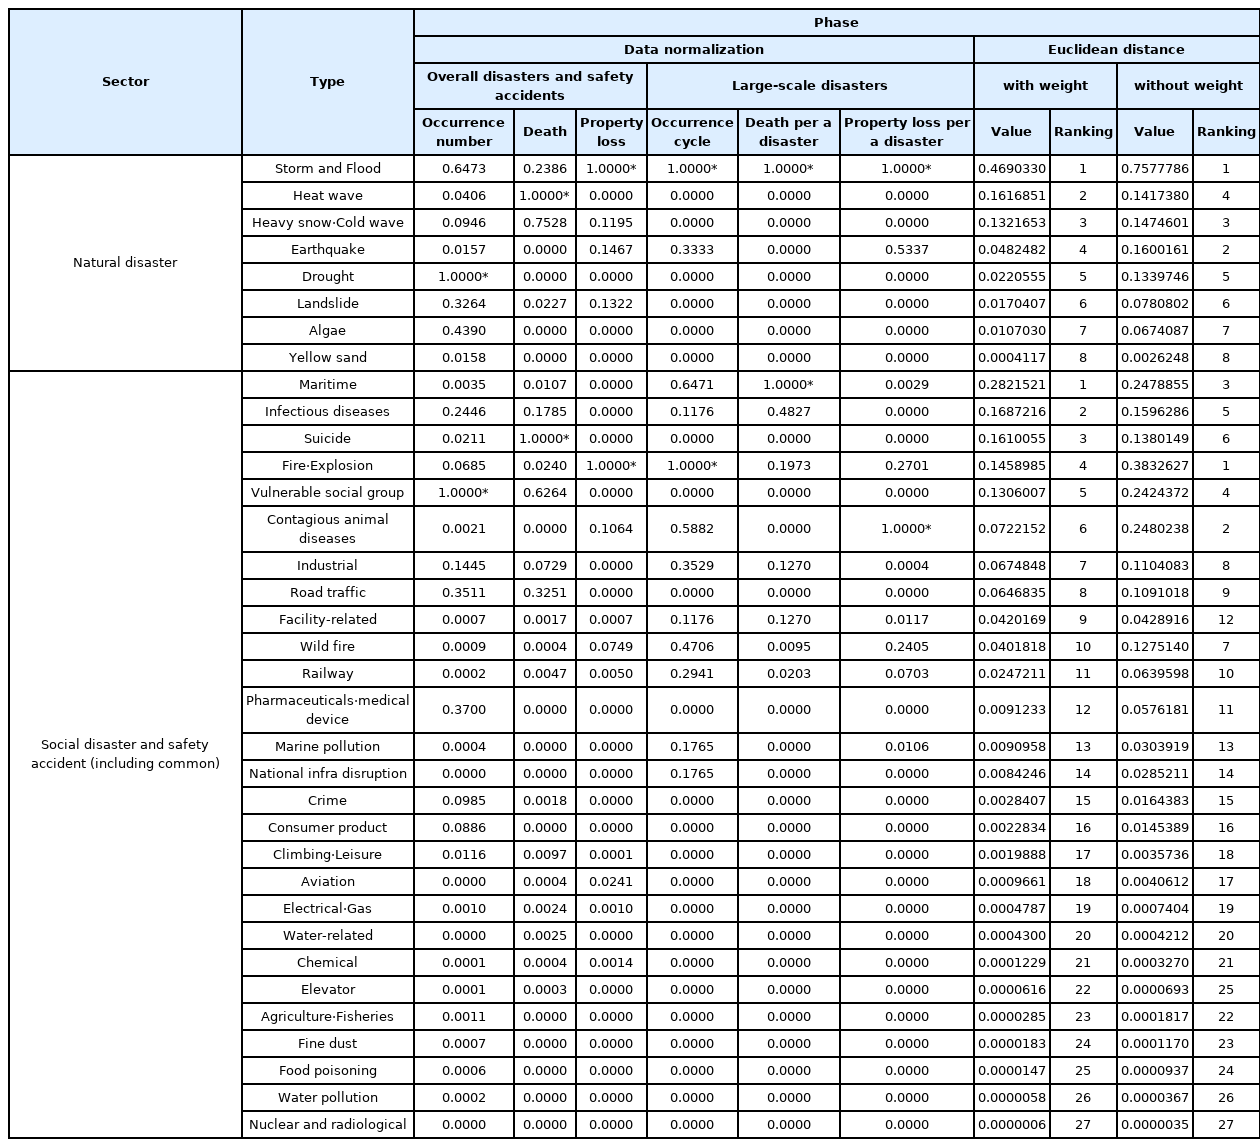
유형별 피해현황 규모의 정량화는 (ⅰ) 재난사고 전체 피해현황으로 최근 5년간 연평균 발생건수, 사망자수, 재산피해를 활용하였으며(Table 4), (ⅱ) 대형재난의 발생특징인 발생주기, 건당 사망자, 건당 재산피해를 활용하였다(Table 6). 이 피해 통계값은 정규화 과정2을 거친 후, 수정 유클리드 거리 산출식(Eq. (4)) 및 AHP로 분석한 가중치(Table 10)를 활용하여 결과값을 도출하였다.
여기서 분석요소별 가중치의 합은 ‘1’이며(wa1 = 0.0748, wa2 = 0.1441, wb1 = 0.2040, wb2 = 0.3273, wc1 = 0.0942, wc2 = 0.1556), 이에 따라 a는 0.2189(wa1 + wa2), b는 0.5313 (wb1 + wb2), c는 0.2498(wc1 + wc2), Dmax 는 0.6266이다.
유클리드 거리는 자연재난과 사회재난 및 안전사고의 분야별 통계값의 편차를 고려하여, 두 개로 나누어 산출하였다. 도출된 결과값이 큰 유형에 상위 순위를 부여하였다. 일부 피해통계 데이터가 없는 경우는 ‘0’으로 추정하여 계산하였다.
Table 11과 같이 분석 결과, 유클리드 거리가 가장 큰 유형은 자연재난에서 풍수해(0.4690330)이다. 다음 순위로는 폭염(0.1616851), 대설 및 한파(0.1321653) 등으로 나타났다. 사회재난 및 안전사고 분야에서 1위는 선박 재난사고(0.2821521)로 나타났다. 다음으로 결과값이 높은 유형은 감염병(0.1687216), 자살(0.1610055), 화재(폭발 포함, 0.1458985), 안전취약계층(0.1306007) 등의 순으로 나타났다.
Investment Priority Among Types of Disaster and Accident Based on Euclidean Distance
자연재난 1위, 풍수해로 인한 피해 규모는 타 유형과 비교 시 월등히 큰 것으로 확인된다. 6개 분석요소 중 4개에서 중첩적으로 최대값 ‘1’을 나타내고 있었다(재난⋅사고 전체 재산피해, 대형재난 발생주기, 건당 인명피해, 건당 재산피해, Table 10 ‘Data normalization’ 참조). 이에 따라 본 연구에서 도입한 가중치를 적용한 유클리드 거리와 개선 전 방식(동일 가중치 적용)에서 모두 1위로 산출되었다(Table 11, ‘Euclidean distance’ 참조).
사회재난 및 안전사고(일부 공통 포함)에서는 가중치를 적용한 결과 산출 시, 유형별 순위에서 많은 변동이 있다. 특히 상위 순위에서 변동이 큰 것으로 확인된다. 개선 전 1위였던 화재⋅폭발은 2개의 최대값(재난⋅사고 전체 재산피해, 대형재난 발생주기)을 포함하고 있음에도 불구하고, 4위로 나타났다. 반면 1위는 선박 재난⋅사고로 나타났다. 선박 재난⋅사고는 이전 방식에 의하면 3위였지만 순위가 상승하였다. 또한 감염병(2위), 자살(3위), 도로교통 사고(8위), 시설물 재난⋅사고(9위) 등은 이전 방식에 의하면 5위, 6위, 9위, 10위에서 순위가 상승하였다. 이러한 유형은 여러 가지 분석요소 중에서 가중치가 높은 대형재난의 건당 인명피해 규모와 재난⋅사고 전체 인명피해가 많은 유형이다. 분석요소 간 중요도가 반영되어, 순위가 변동하고 보다 높은 순위로 도출되었다.
이와 같이 본 연구에서는 재난안전예산 투자우선순위 결정 시, 전문가 설문조사를 통하여 여러 가지 요소 간 중요도를 반영함으로써 보다 명확하고 적정한 결과를 도출할 수 있었다.
4.2.2 투자우선순위 및 중점투자유형 선정(안)
재난안전예산 투자우선순위에서 높은 순위를 차지하는 유형은 발생현황 및 인명⋅재산피해 규모가 큰 유형으로, 재난안전예산 중점투자가 필요한 유형으로 선정해야 한다고 판단된다.
순위 간 결과값의 차이를 이용하여 상위 순위부터 중점투자유형 선정(안) 마련하였으며, Table 12와 같이 2개의 그룹으로 분류하였다. Group Ⅰ은 최우선 중점투자유형으로, 자연재난에서 풍수해, 사회재난 및 안전사고 중 선박 재난⋅사고이다. 이 유형은 각 분야에서 유클리드 거리가 가장 큰 유형이며, 다음 순위와의 결과값의 차이가 가장 큰 구간이다(자연재난 1위 풍수해와 2위 폭염의 차이값은 0.307348이며, 사회재난 및 사고 분야에서 1위 선박 재난사고와 2위 감염병의 차이값은 0.113431). 풍수해의 결과값은 2위인 폭염에 비하여 2.9배 높은 수치이며, 선박 재난⋅사고의 결과값은 다음 순위와 비교하여 1.7배 높은 것으로 나타났다.

Intensive Investment Types for Disaster and Safety Management Projects Budget
Group Ⅱ 중점투자유형은 자연재난에서 폭염과 대설한파, 사회재난⋅안전사고에서 감염병, 자살, 화재⋅폭발, 안전취약계층, 가축전염병, 산업재해, 도로교통사고가 포함된다. 두 번째로 순위 간 차이 값이 크게 나타나는 지점으로 구분되었으며, 이 유형은 분야별로 상위 30% 이내(자연재난 1~3위, 사회재난 및 안전사고 1~8위)에 해당하는 것으로 확인된다. 또한 여기에는 6개 분석요소별 최대값을 나타내는 유형이 포함되어 있다.
상기 유형은 다른 유형에 비하여 재난과 안전사고의 발생과 이로 인한 사망자 및 재산피해 규모가 큰 것으로 나타나, 국가 차원의 재난안전예산 중점투자가 필요한 유형으로 선정하였다. 선정된 중점투자유형은 각 유형별 피해현황⋅전망, 위험발생 요인, 재정투자⋅정책, 투자수요 등을 종합하여 투자방향 수립 및 세부 재난안전사업 편성이 필요하다.
5. 결 론
본 연구에서는 재난안전사업예산 분류체계에 따른 자연재난 8개, 사회재난 및 안전사고 등 27개, 총 35개 유형에 대하여 AHP와 유클리드 거리(Euclidean distance)를 기반으로 재난⋅사고 유형 간 투자우선순위를 산출하였다. 이를 위해 재난⋅사고 전체 피해현황과 대형재난 피해현황, 2개의 측면을 모두 고려하고자 분석요소로는 재난⋅사고 유형별 연평균 발생건수, 연평균 사망자, 연평균 재산피해, 대형재난 발생주기, 대형재난 건당 사망자수, 대형재난 건당 재산피해를 활용하였다. 수정된 유클리드 산식을 이용하였으며, 이때 세부요소 간 가중치는 AHP 기법으로 분석하여 적용하였다. 과거 5년간(2014-2018) 재난과 안전사고의 발생과 피해현황에 대한 통계자료를 수집하여 결과를 도출하였다.
재난과 사고로 인한 피해현황에서 대형재난의 가중치(0.6270)는 전반적인 재난⋅사고(0.3730) 보다 약 2배 이상 중요한 것으로 나타났다. 또한 인명피해의 가중치(대형재난 건당 사망자수 0.3273, 재난⋅사고 전체 사망자수 0.2040)가 발생현황 및 재산피해와 비교하여 높게 평가되었다(대형재난 건당 재산피해 0.1556, 대형재난 발생주기 0.1441, 재난⋅사고 전체 재산피해 0.0942, 재난⋅사고 전체 발생건수 0.0748 순으로 나타남).
이러한 가중치를 반영한 재난⋅사고 유형 간 재난안전예산 투자우선순위는 자연재난에서 풍수해가 1위로, 유클리드 거리는 0.4690330으로 나타났다. 풍수해의 결과값은 2위인 폭염(0.1616851) 및 3위 대설⋅한파(0.1321653)와 비교하여 약 3배 이상 높은 수치로 피해현황 규모가 자연재난 중 절대적으로 큰 것으로 확인된다.
사회재난 및 안전사고 분야에서 1위는 선박 재난⋅사고로, 결과값은 0.2821521이다. 다음으로 2위 감염병(0.1687216), 3위 자살(0.1610055), 4위 화재(폭발 포함, 0.1458985), 5위 안전취약계층 사고(0.1306007), 6위 가축수산생물 전염병(0.0722152), 7위 산업장 산재(0.0674848), 8위 도로교통 재난⋅사고(0.0646835) 등의 순으로 나타났다. 상기 1~8위에 해당하는 8개의 유형은 사회재난 및 안전사고 등(공통 일부 포함) 27개 유형 중 상위 30% 이내에 포함된 것으로 나타났다.
상기 투자우선순위에서 상위 순위로 나타난 유형은 재난⋅사고의 피해 규모가 상대적으로 큰 유형으로, 국가차원에서 우선적인 재난안전관리가 필요한 대상으로 판단된다. 향후 재난안전예산 중점투자유형으로 선정하여, 구체적인 위험요인 파악 및 피해 저감을 위한 세부 사업 마련이 필요하다.
본 연구는 발생건수, 인명피해, 재산피해 등 통계자료에 기반한 직접적인 피해에 초점을 맞추어 분석을 수행하였다. 그러나 이러한 분석결과는 경제적⋅사회적⋅환경적 2차 피해 등이 반영되지 않았다는 한계점이 있다. 통계자료 분석 결과에 근거한 유형 간 투자우선순위를 기초로 하여 ‘사회적 이슈’ 또는 ‘발생가능성’을 추가적으로 고려하여야 할 필요가 있다. 또한 정부의 정책적 중요도(국가안전관리기본계획, 한국판 뉴딜 종합계획, 도로교통⋅산재⋅자살 국민생명 지키기 3대 프로젝트 외 범부처 종합대책 등), 사회 환경변화 및 전문가 의견(유형별 협의체 등) 등을 고려하여 최종적으로 중점투자유형을 선정하여야 할 것이다.
본 연구에서 일부 유형은 모든 분석요소의 통계자료를 확보할 수 없었다. 특히 가뭄, 폭염, 도로교통 재난⋅사고, 선박 재난⋅사고 등 일부 유형은 실제 피해가 발생하지만, 재산피해가 집계되지 않거나 국가공식통계가 제공되지 않았다. 향후 이러한 점을 보완하기 위한 방안 마련 및 추가연구가 필요하다. 또한 최근 5년간 피해통계 자료를 이용하여 단기적인 측면에서 피해현황을 분석하였다. 재난⋅사고 유형 간 피해규모의 상대적인 크기를 비교하여 우선순위 산정이 가능하나, 대형재난의 발생주기를 산정하는데 5년은 비교적 짧은 기간으로 결과값 해석에 한계가 있는 것으로 판단된다. 재난의 발생 특징을 명확하게 도출하기 위하여 분석기간의 확장을 고려할 필요가 있다.
그럼에도 불구하고 본 연구에서는 통계자료에 근거하고 분석요소 간 가중치를 고려하여, 재난⋅사고 발생과 피해정도를 정량화하여 나타내었다. AHP를 통해 도출된 가중치를 적용한 유클리드 거리를 산출하여 재난 및 사고 유형 간 안전관리 우선순위를 결정할 수 있다. 분석결과는 재난⋅사고 유형별 피해현황의 규모 파악을 위한 기초자료로서 의의가 있으며, 재난안전예산 중점투자유형 선정 및 투자방향 제시에 도움을 줄 수 있다.
References
Notes
대형재난의 발생주기(Cho and Choi, 2018)와 피해규모(Lee et al., 2016; Cho and Choi, 2018)는 아래의 수식에 따라 추정할 수 있다.
대형재난 발생주기 = 분석기간 / 발생건수
대형재난 건당 인명피해 = 사망자수 / 발생건수
대형재난 건당 재산피해 = 재산피해 / 발생건수
유클리드 거리를 산출하기 위하여, 통계값을 정규화(Normalization)한다. 분석요소별 최대값을 기준으로, 통계값의 수치를 변환한다. 이때 각 분석요소의 최대값은 ‘1’로 산출된다. 예를 들어 재난⋅사고 전체 발생건수는 다음의 식을 통해 정규화(a1nor(i))한다(Cho and Choi, 2018).
이와 같은 방식으로, 각 분석요소에 대한 유형별 통계값을 정규화 한다. 단, 대형재난 발생주기(a2nor(i))는 아래와 같이 최소값을 기준으로 정규화한다. 각 세부요소 값은 클수록 위험하다. 그러나 대형재난 발생주기는 짧을수록 위험하며, 반대로 발생주기가 길어지면 비교적 안전하기 때문이다(Cho and Choi, 2018).