일체형교대교량의 지진취약도 평가에 적합한 지진강도지표
Efficient Earthquake Intensity Measure for Seismic Vulnerability of Integral Abutment Bridges
Article information
Abstract
본 논문의 목적은 일체형교대교량의 지진취약도를 평가하는데 적합한 지진강도지표(IM)를 판별하는 것이다. 90개의 지진가속도기록과 20가지 IM을 고려한 비선형시간이력해석을 수행하여 교각의 횡방향변위를 관찰하였다. 교량의 내진성능과 상관도가 높은 IM을 판별하기 위해 결정계수, 표준편차, 상관계수 등 다양한 통계인자를 고려하였다. 수치해석결과 상관도가 높은 IM은 고유주기에서의 스펙트럼가속도, 스펙트럼속도, 스펙트럼변위와 ASI, EPA, PGA, A95 등으로 나타났다. 상관도가 높은 IM를 기준으로 한 교량의 지진취약도곡선을 도출하였다.
Trans Abstract
The purpose of this study is to identify efficient earthquake intensity measures (IMs) for evaluating the seismic vulnerability of integral abutment bridges. A total of 90 ground motion records and 20 typical IMs were employed for the numerical analyses. A series of nonlinear time-history analyses was performed on the bridges to observe the lateral displacement of the bridge piers. Statistical parameters such as the coefficient of determination, standard deviation, and correlation coefficient were calculated to identify the strongly correlated IMs with the seismic performance of the bridges. The numerical results show that the efficient IMs are spectral acceleration, spectral velocity, spectral displacement at the fundamental period, acceleration spectrum intensity, effective peak acceleration, peak ground acceleration, and A95. Moreover, a set of fragility curves of the bridges was developed with respect to the efficient IMs.
1. 서 론
내진설계기준에서나 지진구조해석을 수행할 때, 또는 지진취약도평가를 수행할 때, 지진의 강도를 나타내는 지표로 흔히 최대지반가속도(PGA) 또는 스펙트럼가속도(Sa)를 사용한다. 하지만, 건물에 대해서는 PGA나 Sa가 항상 최선의 지진강도지표(earthquake Intensity Measure, IM)는 아니라는 연구결과가 있다(Elenas and Meskouris, 2001; Massumi and Gholami, 2016). 한편, IM과 터널(Chen and Wei, 2013; Nguyen et al., 2019), 액체저장탱크(Phan and Paolacci, 2016), 파이프라인(Shakib and Jahangiri, 2016), 원자력발전소(Nguyen et al., 2020)의 지진응답에 대한 상호관계 연구가 다수 진행되었다.
IM과 교량의 지진손상의 관계에 대한 연구도 많이 수행되었다. Padgett et al. (2008)은 강거더교의 확률론적 지진요구성능모델(Probabilistic Seismic Demand Model, PSDM)에 적합한 IM을 평가하여 PGA와 Sa (T1)이 합성지진파에, 누적절대속도(CAV)가 실측지진파에 가장 적합하다는 결론을 도출하였다. Zhang et al. (2015)은 원거리지진의 IM과 사장교의 손상 간의 관계를 조사하여 Velocity Spectral Intensity (VSI), Sa (T1), Housner Intersity (HI)를 상관도 높은 IM으로 제시하였다. Jahangiri et al. (2018)은 Root Mean Square of Acceleration (Arms)가 콘크리트아치교에 가장 적합한 IM이라고 하였으며, Zelaschi et al. (2019)은 RC교량에 대한 연구를 통해 Fajfar index (Iv), 최대지반속도(PGV), Sa이 최적의 IM이라고 제시하였다. Avşar and Özdemir (2013)는 가속도에 기반한 IM은 면진교량의 응답과의 상관도가 다소 낮은 반면, VSI, HI, Modified Acceleration Spectrum Intensity (MASI), Sa와 같은 주기관련 IM이 면진장치의 최대변위와 밀접한 관련이 있다고 하였다.
일체형교대교량의 내진성능과 관련된 연구는 정적해석에 기반한 연구(Zordan et al., 2011; Choi et al., 2019)와 동적해석에 기반한 연구(Dicleli and Erhan, 2011; Franchin and Pinto, 2014) 등 다수 진행되었다. 그러나 IM과 일체형교대교량의 상관관계에 대한 연구는 거의 없다.
본 연구의 목적은 20가지 IM을 이용한 일체형교대교량의 PSDM을 개발하는 것이다. 다양한 진폭, 규모, 진원거리, 지속시간, 고유주기를 포괄하는 90개의 지진기록을 이용하여 해석교량에 대한 비선형시간이력해석을 수행하였다. PSDM에 기반하여 해석교량의 지진응답 평가에 적합한 IM을 판별하였다. 추가적으로 이들 IM에 대한 지진취약도곡선을 도출하였다.
2. 일체형교대교량의 모델링
2.1 교량의 제원
해석대상교량은 Fig. 1과 같이 7경간(26 m + 5@35 m + 26 m)으로 구성되었으며, 모든 교각의 높이는 15 m이고 교대의 높이는 10.4 m이다. 거더는 Fig. 1과 같이 다양한 RC박스단면으로 구성되어 있으며, 교각단면의 치수와 철근배치는 Fig. 2에서 보여준다. 교각의 기초는 3개의 파일로, 교대는 9개의 파일로 지지된다. 보다 자세한 설계정보는 Choi et al. (2019)에서 찾아볼 수 있다. 이 교량은 일체형교대교량의 형식으로 되어 있으나, 같은 형식의 교량이라도 설계조건에 따라 거동특성은 다소 다를 수 있다.

Elevation View of the Bridge and Girder Dimensions
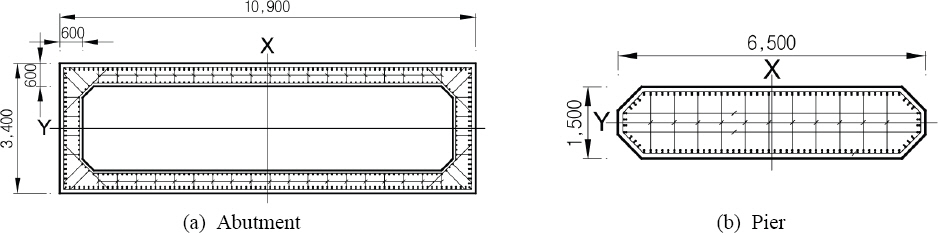
Cross Sections and Reinforcing Details
2.2 수치해석 모델
교량의 해석모델은 범용 구조해석프로그램 SAP2000 (CSI, 2015)을 이용하여 구성하였다. 교량의 상부구조는 탄성거동하는 것으로 가정하였고, 교각과 교대는 비선형 보-기둥요소를 이용하여 모델링하였다. 콘크리트의 재료모델은 맨더모델(Mander et al., 1988)을, 철근의 재료모델은 Park and Paulay (1975)가 제안한 모델을 적용하였다. 지반-구조 상호작용을 고려하기 위해서 탄성보요소로 모델링한 파일에 지반스프링을 부착하는 방법으로 모델링하였다. 교량의 지반조건은 풍화암 위에 조밀한 모래층이 위치한 것으로 가정하였다. Fig. 3은 교량의 상부구조, 교대, 파일과 지반스프링 등의 모델구성을, Fig. 4는 교량전체의 3D 유한요소모델을 각각 보여준다.
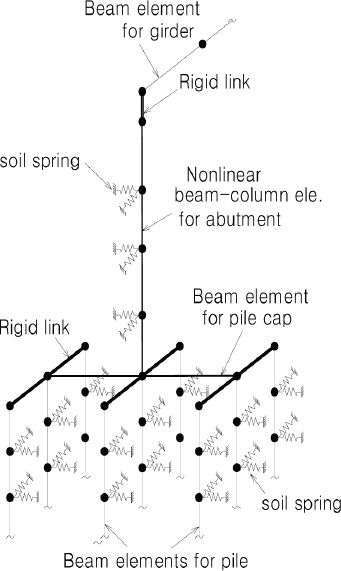
Modeling Schemes of the Bridge Elements
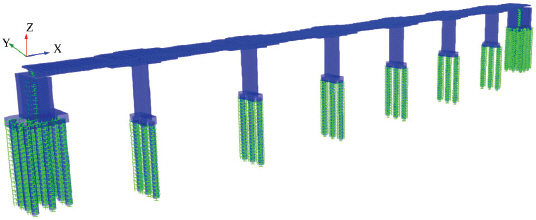
3D FEM Model of the Bridge
3. 지진강도지표와 지진파
3.1 지진강도지표
IM은 진폭, 주파수특성, 지속시간 등 지진파의 중요한 특징을 정량적으로 나타내며 다양한 IM이 제시되었다(Kramer, 1996). 본 연구에서는 Table 1의 20가지 IM을 연구대상으로 선정하였고 개별 지반가속도에 대해 IM을 각각 계산하였다.
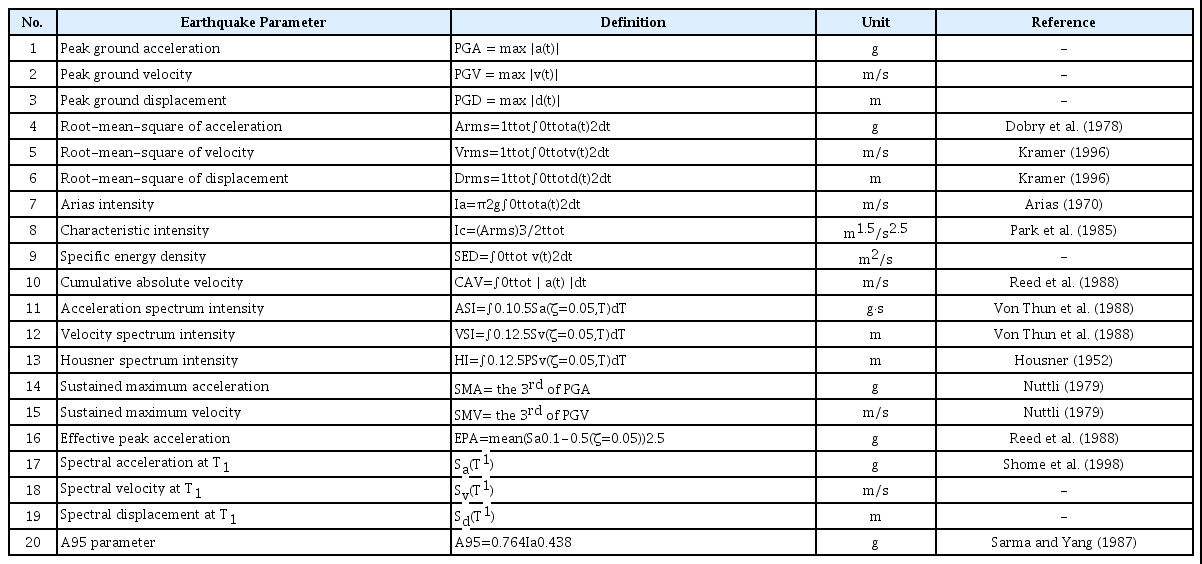
Seismic Intensity Measures
3.2 지진파 선정
본 연구에서는 PEER center database (PEER Center, 2019)에서 제공하는 지진파 중 진폭, 규모, 진원거리(Rb), 지속시간(D5-95), 고유주기(Tp) 등이 충분히 넓게 분포하도록 90개의 지진가속도기록을 선정하였다. 몇 가지 특성지표에 대한 범위는 다음과 같다:
• 0.093 g ≤ PGA ≤ 1.585 g
• 0.25 ≤ PGA/PGV ≤ 3.294
• 5.0 ≤ Mw ≤ 7.8
• 0.07 km ≤ Rb ≤ 89.76 km
• 2.79 sec ≤ D5-95 ≤ 60.77 sec
• 0.04 sec ≤ Tp ≤ 1.24 sec
선정된 지진파의 응답스펙트럼을 Fig. 5에 나타내었다. 평균응답스펙트럼은 Eurocode 8 (EN 1998-1, 2005)의 class A와 class B에 해당하는 응답스펙트럼 사이에 위치하는 것을 알 수 있다.
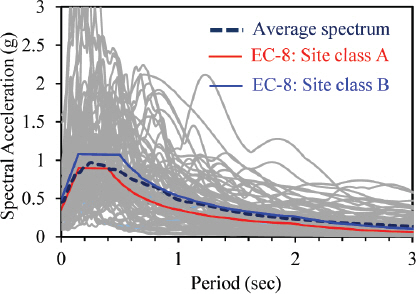
Response Spectra of Selected Ground Motions
4. 확률론적 내진요구성능모델
성능기반내진설계에서는 IM과 구조물의 내진요구성능의 관계를 나타내는 PSDM이 적절히 정의되어야 하는데, Eq. (1)과 같이 지수함수의 형태로 표현하는 것이 가장 일반적이다(Cornell et al., 2002; Padgett et al., 2008; Jahangiri et al., 2018).
여기서, SD는 요구성능의 중간값이고 a와 b는 회귀분석계수이다. 이 방정식은 Eq. (2)와 같이 선형회귀분석의 형태로 표현할 수 있다.
지진취약도분석에서 주어진 지진강도에 대해 요구성능(D)이 보유성능(d)을 초과하는 조건부파과확률을 다음과 같이 표현할 수 있다.
요구성능과 보유성능이 대수정규분포를 따른다고 가정하면, Eq. (3)을 다음과 같이 나타낼 수 있다.
여기서, Φ[⋅]는 표준정규분포의 누적확률분포함수를, σD│IM 는 대수표준편차를 나타낸다.
5. 지진강도지표의 효율성 평가
지진가속도를 해석교량의 교축방향(X방향)과 교축직각방향(Y방향)으로 동시에 재하하여 시간이력해석을 수행하였고, 교각의 교축방향 및 교축직각방향 최대변위(EDP)를 추적하였다. 그리고 본 연구에서 고려한 모든 IM에 대해 교량의 PSDM을 도출하였다. IM의 적합성은 통계지표인 PSDM의 결정계수(R2), 표준편차, 상관계수를 이용하여 평가하였다. 결정계수와 상관계수는 숫자가 클수록, 표준편차는 작을수록 더 적합한 것으로 평가한다.
Figs. 6과 7은 다양한 IM과 P3교각의 교축 및 교축직각방향 최대변위의 관계를 산점도(Scatter plot)로 나타낸 것이다. 교량의 교축방향강성이 교축직각방향강성에 비해 훨씬 크 기 때문에 교각의 교축직각방향응답이 더 크게 계산되었다. P3 이외의 교각 및 교대의 응답도 비슷한 경향을 보여주었다.

Scatter Plots of EDP of Pier P3 in X-direction for Various IMs
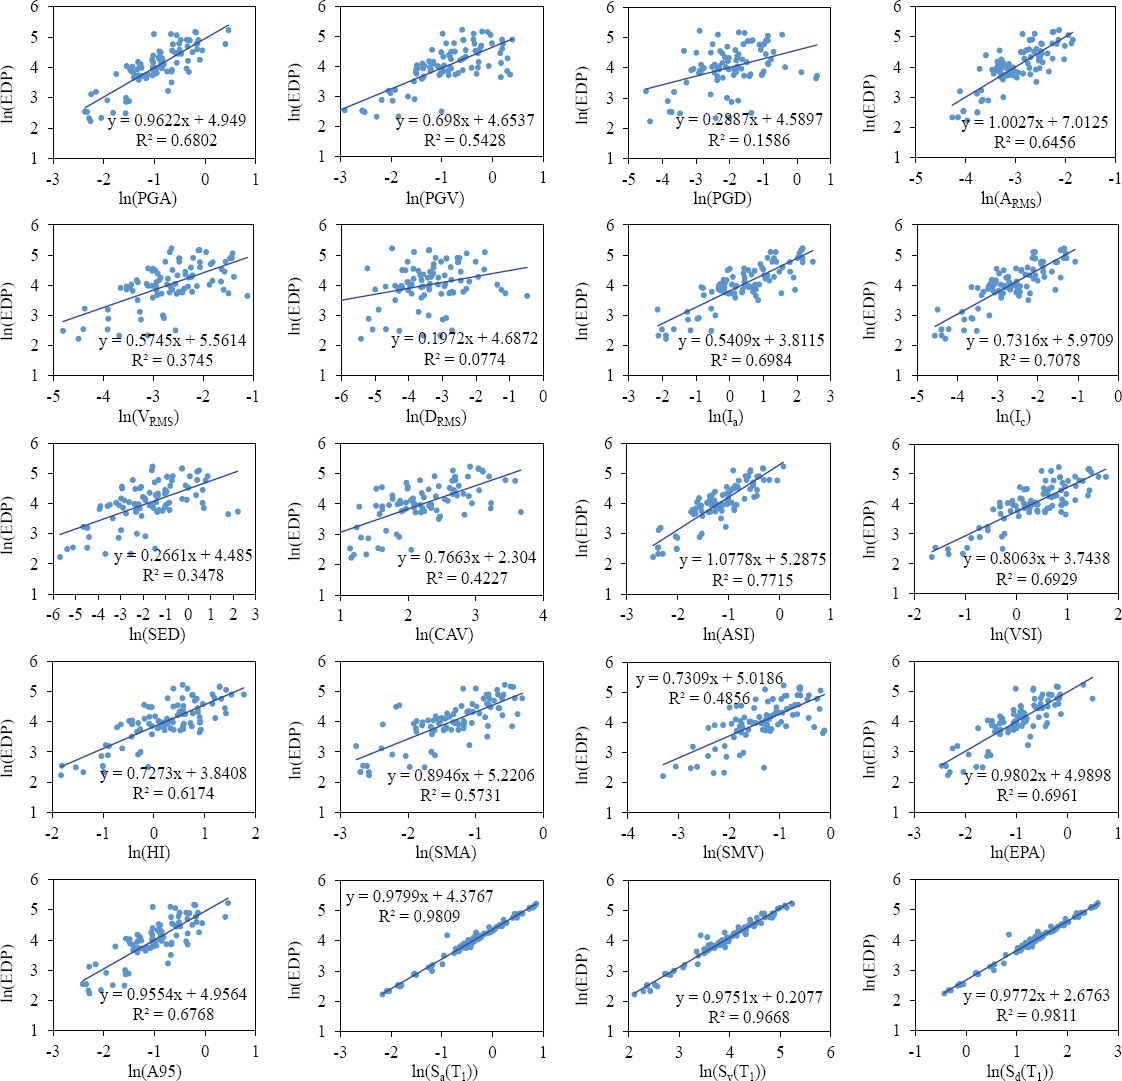
Scatter Plots of EDP of Pier P3 in Y-direction for Various IMs
Fig. 6에서 ASI에 대한 교축방향 PSDM에서 R2이 가장 크게 계산된 것을 볼 수 있고, Sv (T1), EPA, Sa (T1), PGA, Sd (T1), A95, Ic가 그 뒤를 이었다. 반면에 Fig. 7에서 볼 수 있듯이, 교축직각방향 PSDM에서는 Sa (T1), Sv (T1), Sd (T1), ASI, Ic, Ia, EPA, VSI, PGA의 순서로 R2이 크게 계산되었다. 다양한 IM에 대한 교량응답의 산점도로부터 계산된 상관계수와 표준편차는 Fig. 8에 나타내었다. 상관도가 높은 IM은 Sa (T1), Sv (T1), Sd (T1), ASI, EPA, PGA, A95, Ia, Ic의 순서로 나타났다.

Correlations and Dispersions of PSDM of the Pier with Respect to Various IMs
6. 지진취약도 분석
이 절에서는 최적화된 IM, 즉, Sa (T1), ASI, EPA, PGA에 대한 교량의 지진취약도곡선을 도출하였다. 앞서 교축방향보다 교축직각방향이 지진에 더 취약한 것으로 평가되었으므로, 본 논문에서는 교축직각방향에 대한 지진취약도곡선을 도출하였다. 지진취약도곡선을 도출하기 위해서는 교량의 손상한계를 정의해야 한다.
6.1 한계상태
지진이 발생하면 교량에서는 교각이 가장 취약한 요소이므로, 교각에 대한 손상상태를 정의하고 이를 취약도분석에 이용하였다. 본 연구에서는 Buckle et al. (2006)이 제안한 곡률연성도비(Curvature ductility ratio, μφ)와 변위연성도비(Displacement ductility ratio, μΔ)에 기반하여 교각의 손상상태를 다음과 같이 정의하였다.
실질적으로는 곡률보다 변위에 기반한 손상상태정의가 더 많이 사용되는데, Eq. (5)는 변위연성도비에 대하여 다음과 같이 표현할 수 있다.
여기서, L은 교각의 높이, lp는 Eq. (7)의 소성힌지길이를 나타낸다.
여기서, db는 교각 주철근의 직경이다.
본 연구에서는 Fig. 9와 같이 소성힌지 구간에 해당하는 교각의 모멘트-곡률관계를 기반으로 약간(slight)손상, 중간정도(moderate)손상, 심각한(extensive)손상, 붕괴(collapse)의 4단계 손상상태(DS)를 정의하였고, 이를 변위연성도비로 환산하여 Table 2와 같이 한계상태를 설정하였다. 이와 같은 한계상태 설정은 기존 연구에서도 사용된 바 있다(Choi et al., 2004). 해석교량은 모든 교각의 높이가 같기 때문에 Table 2의 한계상태는 모든 교각에 같게 적용되었다.
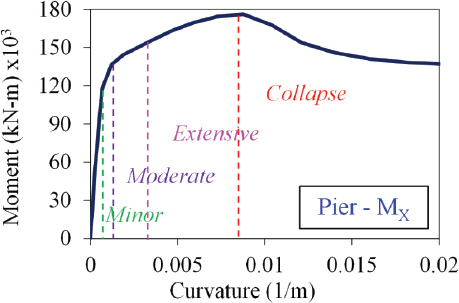
The Definition of Damage States for the Bridge Pier
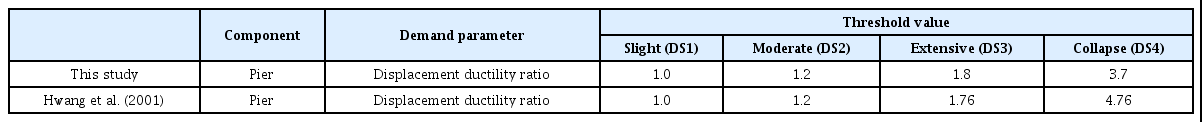
Damage States of the Integral Abutment Bridge and Indices of Hwang et al. (2001)
6.2 지진취약도 곡선
지진취약도 곡선을 도출하기 위해서는 조건부확률분포의 평균과 표준편차를 계산해야 한다. 이들 통계지표는 앞선 회귀분석 과정에서 이미 계산된 바 있다. Fig. 10은 효율적인 IM으로 선정된 Sa (T1), ASI, EPA, PGA에 대한 교량의 지진취약도곡선을 보여준다. PGA나 EPA가 0.2 g 미만이거나 Sa (T1)이 0.4 g 미만인 경우 교량은 지진에 의해 손상을 전혀 입지 않는 것으로 평가되었다. PGA, EPA, ASI가 1.0 g 이하인 경우 교량은 중간정도 이하의 손상이 발생하는 것으로 나타났다. Fig. 10에서 볼 수 있듯이, 효율적인 IM에 대한 지진취약도 곡선은 크게 다르지 않다는 것을 알 수 있다. 다양한 지진강도지표와 한계상태에 대한 취약도곡선의 평균과 표준편차를 Table 3에 나타내었다.
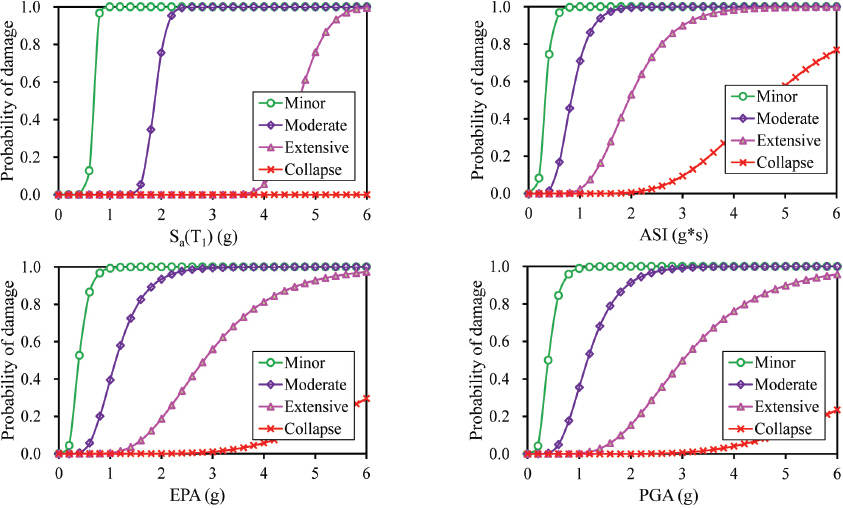
Fragility Curves of the Bridge with Respect to Strongly Correlated IMs
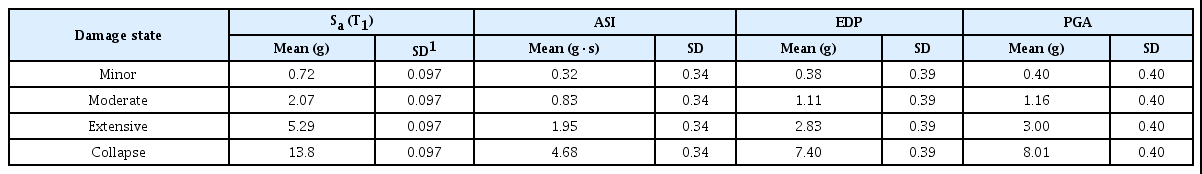
Means and Standard Deviations for Fragility Functions
7. 결 론
본 연구에서는 다양한 지진강도지표에 대한 PSDM을 개발하고, 회귀분석과 통계지표를 통해 일체형교대교량의 내진성능을 평가하는데 적합한 지진강도지표를 판별하였다. 90개의 지진파를 고려하여 교량의 비선형 시간이력해석을 수행하여 교각의 최대변위를 추적하였다. 교각의 손상정도를 한계상태로 하는 지진취약도곡선을 교량의 내진성능과 상관도가 높은 지진강도지표의 함수로 표현하였다. 본 연구를 통해서 도출한 결론은 다음과 같다.
• 일체형교대교량의 PSDM에 대한 최적의 지진강도지표는 Sa (T1), Sv (T1), Sd (T1), ASI, EPA, PGA, A95, Ia, Ic이다.
• PGA가 0.2 g 미만인 지진에 대해 일체형교대교량은 안전하다. 또한 PGA가 1.0 g 미만인 지진에 대해 심각한 손상은 발생하지 않는다.
감사의 글
이 논문은 행정안전부 극한재난대응 기반기술개발사업의 지원을 받아 수행된 연구임(2020-MOIS31-013).