The Local Observed Trends and Variability in Rainfall Indices Over the Past Century of the Yom River Basin, Thailand
Article information
Abstract
강우 패턴의 변화는 홍수나 가뭄과 같은 극한 수문 사상 의발생빈도에 직접적으로 영향을 미칠 수 있으며 물 공급이나 홍수관리 등과 관련하여 이해당사자들 간의 분쟁을 초래할 수 있다. 본 연구의 목적은 과거 90년(1921~2015)의 기간을 대상으로 Yom강유역에 대한 강우량의 변동성을 분석하는 것이다. 이를 위하여 13개 수문관측소의 강우 자료를 기반으로 강우와 관련된 다양한 극한 사상들에 대한 장기경향성분석을 Mann-Kendall 방법을 이용하여 신뢰 수준 95%에서 수행하였다. 대상 변수는 연 총강수량(PRCPTOT), 연속건조일수(CDD), 연속습윤일수(CWD), 호우일수(R10), 대형호수일수(R20), 일최대강우량 (Rmax1), 5일 최대강우량(Rmax5), 연간총강우일수(Rday) 등이다. 주요한 결과로서 PRCPTOT, Rmax1, Rmax5는 대상 유역의 서부지역에서 증가추세를 보이는 것으로 나타났다. 또한 CDD지수의 경우 대상유역내 55% 이상의 지역에서 감소추세를 보였다. 한편, CWD는 Yom강유역 하류지역을 제외하고는 유역면적의 약 77%를 차지히여 증가 추세를 보이는 것으로 나타났다. 연간 총강우일수는 대상 유역의 남부지역 약 44%에서 감소 경향을 나타냈다. 그러나 호우와 대형 호우의 경우 Yom강유역 하류지역에 서 상당한 증가 추세를 보임을 확인할 수 있었다. 이러한 결과들은 Yom강유역의 서부지역에서 현저한 홍수의 증가 경향을 시사한다. 한편, 대상 유역의 중심부에서는 가뭄의 경향이 증가하는 것으로 나타났다. 따라서 Yom강유역내 강우 패턴의 변화는 향후 해당지역의 수자원계획과 관리를 위하여 반드시 그 영향을 고려하야 할 것이다.
Trans Abstract
A changing rainfall pattern can directly affect the frequency of occurrence of extreme event such as floods and droughts. These extreme events will cause future political conflicts, especially those dealing with water supply and flood management. The purpose of this study is to examine the variability of rainfall in the Yom River basin, Thailand, during the past 90 years (1921–2015). Based on rainfall data from 13 hydrological stations, long-term trends inrainfall and various rainfall-related extreme events, which consist of the annual total precipitation (PRCPTOT), consecutive dry days (CDD), consecutive wet days (CWD), number of heavy rainfall days (R10), number of very heavy rainfall days (R20), daily maximum rainfall (Rmax1), five-day maximum rainfall (Rmax5), and annual total rainy day (Rday) in the Yom River basin, were analyzed using the Mann-Kendall method with 95% confident level. The results suggest that for the PRCPTOT, Rmax1, and Rmax5 indices have experienced a significant increase trend in the western part of basin area. In addition, the decreasing trend was observed over 55% of basin considering for the CDD indices. Meanwhile, the CWD was found an increasing trend approximately 77% of the basin area except in the lower Yom River basin. Result of the annual total rainy day reveal significant decrease trend around 44% of the southern part of the basin. However, the analyses of heavy and very heavy rainfall show a significantly increasing trend at the lower part of the Yom river basin. These results suggest that the trend of flooding has significantly increased along the western part of the Yom River basin. Meanwhile, the tendency of drought events is increasing in middle portion of the basin. The impacts of changes in rainfall pattern in the Yom River basin should be considered in the future water resources planning and management of the country.
1. Introduction
Precipitation is one of the most important parameters in the design and planning of water resource management (Adamowski and Bougadis, 2003) Rainfall is the key factor in rainfall-runoff relationship, which is a crucial component in flood/drought assessment (Chattopadhyay and Edwards, 2016). Changes in daily rainfall pattern have been reported in many areas such as the Mediterarnean region (Philandras et al., 2011), United States (Karl and Knight, 1998; Pagán et al., 2016), Canada (Aziz and Burn 2006), Pakistan (Ahmad et al., 2015), Australia (Barua et al., 2013). Furthermore, it was also suggested that extreme precipitation events have been increasing in intensity and frequency. For example, the elevated frequencies of extreme precipitation events were found in the central, western, and northern United States possibly resulting in hydrological flood events in some areas of the U.S. (Kunkel and Andsager,1999; Kunkel et al., 2003). In contrast, the dry areas become drier and the wet areas become wetter in some regions of the world (Beule et al., 2016). For example, in the Maghreb countries (Algeria, Morocco and Tunisia) of Northern Africa, display significant decreasing trends of total precipitation and wet days, whereas the duration of dry periods of the region tends to increase (Tramblay et al., 2013; Di Baldassarre et al., 2010).
For Thailand, rainfall pattern trend was obtained by several studies. Based on analyses of long-term trends of rainfall indices over the Indochina Peninsula using Asian Precipitation-Highly-Resolved Observational Data Integration towards Evaluation of Water Resources (APHRODITE) data (1960-2007) with a spatial resolution of 0.5°×0.5°, Yazid and Humphries (2015) suggested that Thailand’s annual rainfall pattern duringthe past five decades is mainly dominated by a non-significant negative trend, and the country experienced a negative trend in number of dry days (CDD), and a positive trend in the number of wet days (CWD). Meanwhile, Beule et al. (2016) found an increasing trend in CDD and a decreasing trend of CWD from the rainfall data from 48 stations across the country during the period 1964-2012. With a different dataset and number of rainfall stations, it possibly resulted from a different trend in a regional and national scale of existing studies. Therefore, analyses of long-term rainfall trend in local scale may be needed for better understanding of changes in hydrological processes that play a major role for effective water supply and demand management.
The objective of this study is to analyze long-term trends of daily rainfall indices over the Yom River basin, where floods and droughts are common, using rainfall data observed at 13 hydrological stations during the period 1921-2015. The non-parametic statistical method, the Mann-Kendall test, was used to determine the long-term trend in 8 rainfall indices recommended by Expect Term on Climate Change Detection and Indices (ETCCDI) (Yazid and Humphries, 2015; Tramblay et al., 2013). The selected indices, which provide information on the wetness and dryness, consist of annual total precipitation (PRCPTOT), the number of heavy rainfall days (R10≥10 mm), number of very heavy rainfall days (R20 ≥20 mm), consecutive wet days (CWD≥1 mm), daily maximum rainfall (Rmax1), five-day maximum rainfall (Rmax5), annual rainy day total (Rday), and consecutive dry days (CDD<1 mm). The results of this study will contribute information on trend and variability of rainfall extremes that are useful for an effective water resources planning and management in the Yom River basin.
2. Study Area and Data Set
2.1 Study Area
The Yom River basin originates in the northern part of Thailand. The basin is situated between 14°50’ - 18°25’ northern latitudes, and 99°16’ - 100°40’ eastern longitude (Apichichat, 2014). The Yom River basin is a part of the Great Chao Phraya River Basin, which is the largest drainage basin in Thailand and is located in the heart of the country. The drainage area of the Yom River basin is approximately 24,074 km2. as show in Fig. 1. The elevation of the basin broadly ranges between 20 and 360 m above mean sea level (MSL) (Petchprayoon et al., 2010). The main channel of the river is 735 km in length with the river gradient varying from 1:700 to 1:35,000 (Bidorn et al., 2015). The river flows from north to south through eleven provinces before merging with the Nan River to form the Chao Phraya River in Nakhon Sawan Province (RID, 2004).
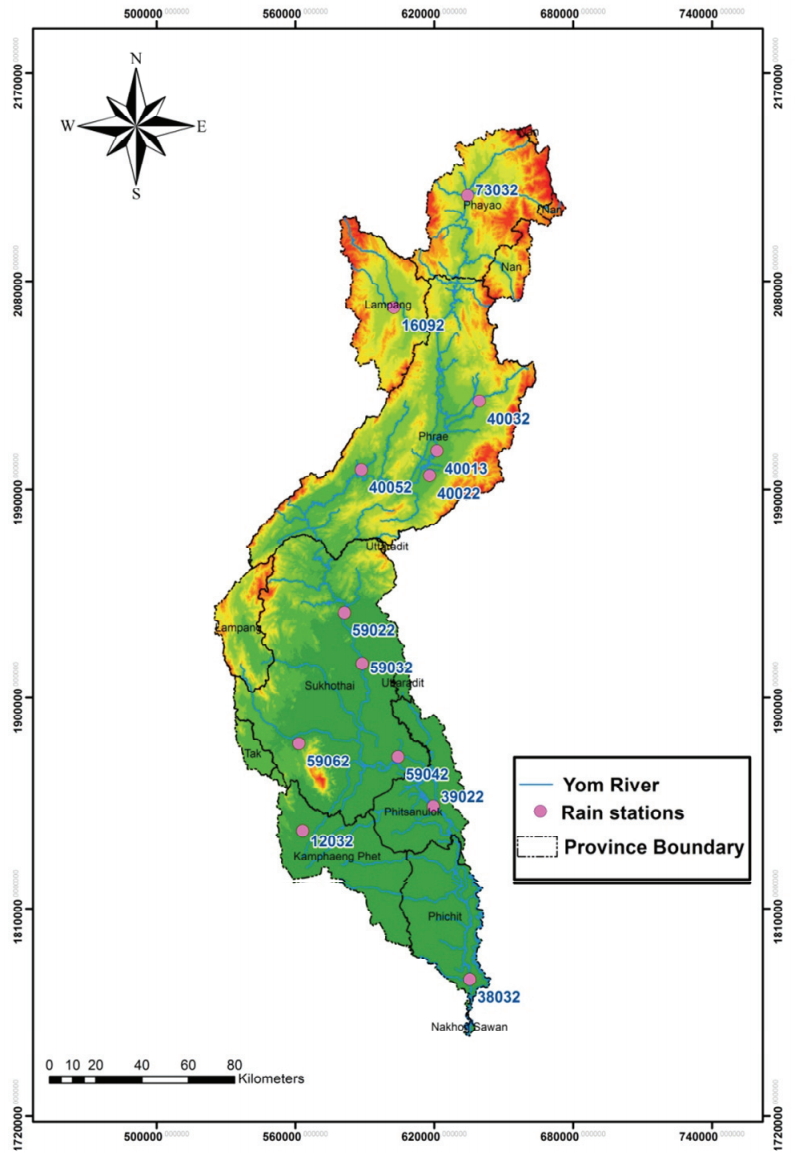
location map of the Yom River Basin and the location of hydrological stations
The Yom River basin can be divided into two district terrain systems: the upper and lower Yom River basins. The upper Yom River sub-basin is characterized by mountainous features with the elevation varying between 280 and 360 m MSL. About 51 percent of upper Yom River sub-basin is forested, and the remaining terrain consists of agricultural and urban areas (Petchprayoon et al., 2010). The lower Yom River basin is defined by a floodplain with the geographic relief ranging from 20 to 180 m MSL. Approximately 74 percent of the lower Yom River basin is occupied by farming and residential areas, while the rest of the basin (26 percent) is a forest area (Geo-Informatics and Space Technology Development Agency (GISTDA), 2005). The climate of the Yom River basin is under the influence of the southwest and northeast monsoons. The mean annual rainfall is approximately1,250 mm (Bidorn et al., 2015) with the minimum and maximum of 800 and 1,600 mm, respectively. Almost 90 percent of the annual rainfall occurs during the rainy season (May to October) and is caused by the southwest monsoon. The mean annual discharge of the basin varies from 200 to 2,000 m3/s (Sriariyawat et al., 2013).
2.2 Rainfall Data and Quality Control
In this study, daily rainfall data from 13 hydrological stations across the Yom River basin during the period 1921-2015 were collected from the Royal Irrigation Department (RID) and Thai Meteorology Department (TMD). The locations of the stations are depicted in Fig. 2, and the basic information of the rainfall data from each station is summarized in Table 1. Of the 13 hydrological stations, 6 stations are situated in the upper Yom River basin (73032, 16092, and 40032 station are located in the mountainous areas and 40052, 40013, and 40022 stations are in the agricultural areas). The rate of missing data at these stations ranged between 5 and 12 percent. Meanwhile, the rainfall datasets from the remaining stations located in the lower Yom River basin (59032, 59042, 12032, 38032, and 39022 station are located in the mountainous areas and 59062 and 59022 stations are in the agricultural areas). Because rainfall record length of those 13 stations are more than 25 years, these rainfall datasets are statistically valid for analyzing rainfall trend. However, if missing data more than 5 percent during the rainy season (May-September) for a year is found, that year is discarded from the trend analysis (Costa et al., 2008; Tramblay et al., 2013).
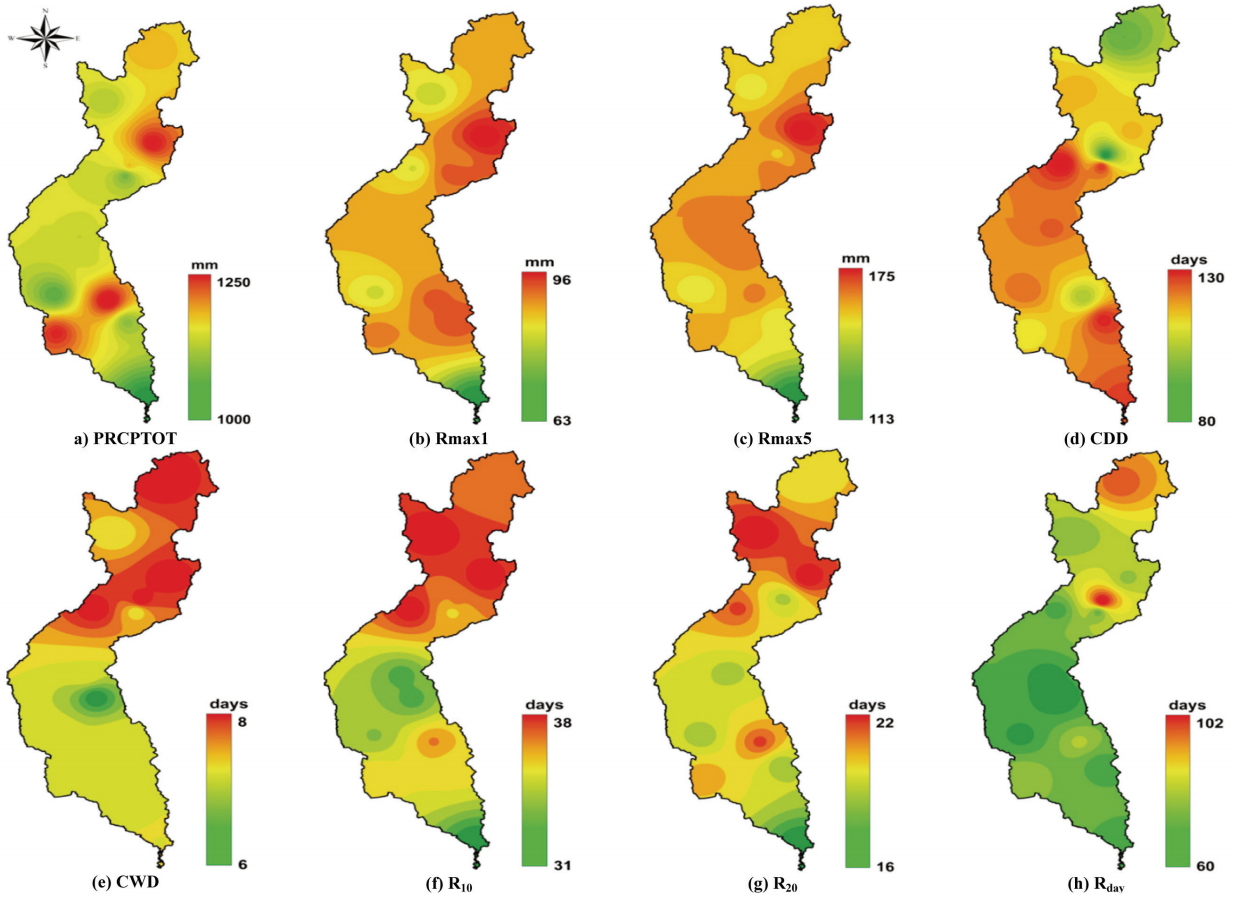
Long-term of mean climatology over the Yom river basin
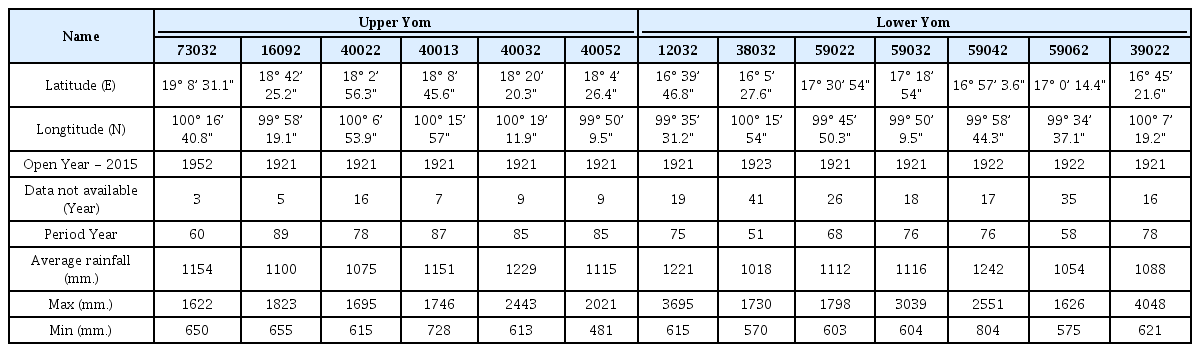
Detail of Rainfall Stations
A homogeneous is identified as one in which variations are caused only by variations of climate, not by changes in station location (Shrestha et al., 2016). In this study, the homogeneity of the rainfall data is checked using the Pettit test which widely used to detect change point in hydrological time series. However, it should be noted that, this study do not attempt to adjust the data as a result of the homogeneity test (Caesar et al., 2011).
The Pettitt test (Pettitt, 1979), the ranks (rn) of samples (Yn) are used to calculate the statistic as follow Equation (1)
The statistical change point is calculate by Equation (2)
If a break point happens in year E, then the statistics is the maximal or minimal near the year k = E
3. Method
3.1 Extreme Rainfall Indices
To investigate long-term patterns in annual rainfall and extreme rainfall events in the Yom River basin, the rainfall data series observed during the past nine decades were used. The original approach of rainfall event analysis was adapted from World Meteorological Organization (WMO, 2009) and established by several indices that have been widely used to determine trends, such as frequency and intensity of extreme weather events. In this study, 8 rainfall indices that represent frequency and intensity of rainfall pattern and rainfall extremes were selected as detailed in Table 2. Frequency indices compose of CDD, CWD, R10, R20, and Rday whereas PRCPTOT, Rmax1, Rmax5 are intensity indices. Trends of these eight rainfall indices were analyzed to assess if the climate dynamic occurred in the Yom River basin.
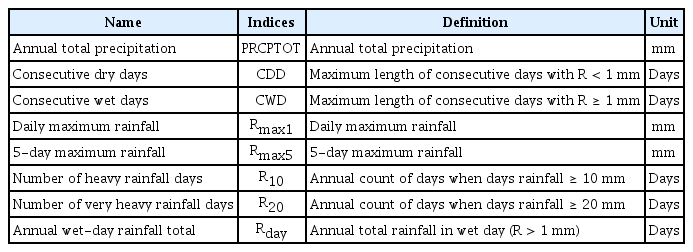
Definition of Rainfall Indices
3.2 Trend Analysis
Many different techniques have been proposed for statistical analyzing trend of time series data. Those techniques can be categorized as parametric and non-parametric methods. A parametric method is normally used to detect trends in data with independent and normal distribution (Gocic and Trajkovic, 2013). In contrast, a non-parametric method can be used to identify a trend in independent data with skewness. The Mann-Kendall (MK) test is one of the most effective non-parametric methods to test for randomness againt trends in hydrologic and climatic time series (Portal and Kahya, 2006; Gajbhiye et al., 2016), and the MK test is low sensitivity to missing data (Yazid and Humphries, 2015). Önaz and Bayazit (2003), which suggests that the parametric method, the t-test, has less accuracy than a non- parametric test for detecting trends in data with skewness. During the last decade, the Mann-Kendall test has been widely used in trend analyses in many studies (Chattopadhyay and Edwards, 2016; Salami et al., 2014; Longobardi and Villani, 2009).
The Mann-Kendall test is based on statistics (S) for a time series of the length. The S is defined by Equation (3)
where xj and xk are the time series observations in chronological order, n is the length of the time series, and sgn can be obtained from Equation (4)
The standardized Mann-Kendall test statistics (Z), which is used to evaluate the statistical significant of a trend, is calculated using Equation (5)
where v(s) is variance of S calculated from equation (6)
A positive S value indicates an increasing trend in the time series. Meanwhile, a negative S value indicates that the time series hasa decreasing trend. To test for upward or downward trends at αlevel of significance (ρ-value), the null hypothesis (H0) is rejected when the absolute value of Z is greater than Z1-α/2, where Z1-α/2and α are the standard normal deviates and significance level for the test, respectively. If the null hypothesis in invalid, the trend is significant, meaning that the trend did not occur by chance. In this study, the 5 % significance level (Z0.025=1.96) was used.
In addition, the Sen non-parametric test (Sen, 1968) can be used to calculate the magnitude of trends in the time series data. The test proceed by calculating the slope of a change in observation values to the change of the corresponding times. According to Sen’s test, the overall estimator bsen is the median of the data slopes, and it can be calculated from Equation (7)
where Xi and Xj are data values at time i and j, respectively.
4. Result and Discussion
In this study, the significance and magnitude of trends in the selected rainfall indices were analyzed based on the long-and short-terms data sets for each hydrologic station. The long-term trend was calculated using rainfall time series during 1921-2015 to investigate the impact of climate change in the river basin. The short-term trends, which probably provide information on current rainfall situations and frequency extreme events of the basin, was analyzed based on 15-years rainfall datasets (2000-2015). Moreover, for the long-term series, to determine the change point using Pettitt's test found that four out of 13 rainfall stations namely; 16092, 40013, 59022 and 59062 detected change point in Year 1952, 1952, 1956 and 1980, respectively. However, the Mann-Kendall test appeared that there were an significant increasing trend at station 16092 and 59062.
Fig. 2 and Fig. 3 represent the map of mean climatology of annual indices for long-term and short-term, respectively. The annual indices were computed annually. The map of mean climatology of annual indices can be estimated through spatial interpolation technique with Inverse Distance Weighting (IDW) by using GIS software (Yang et al., 2015). The mean climatology of annual indices were averaged and then interpolated from one index value per year in each station. Table 3 and Table 4 showed value of average annually indices for long-term and short-term, respectively. Results from trend analyses of the rainfall and rainfall-related extremes in the Yom River basin are discussed below.
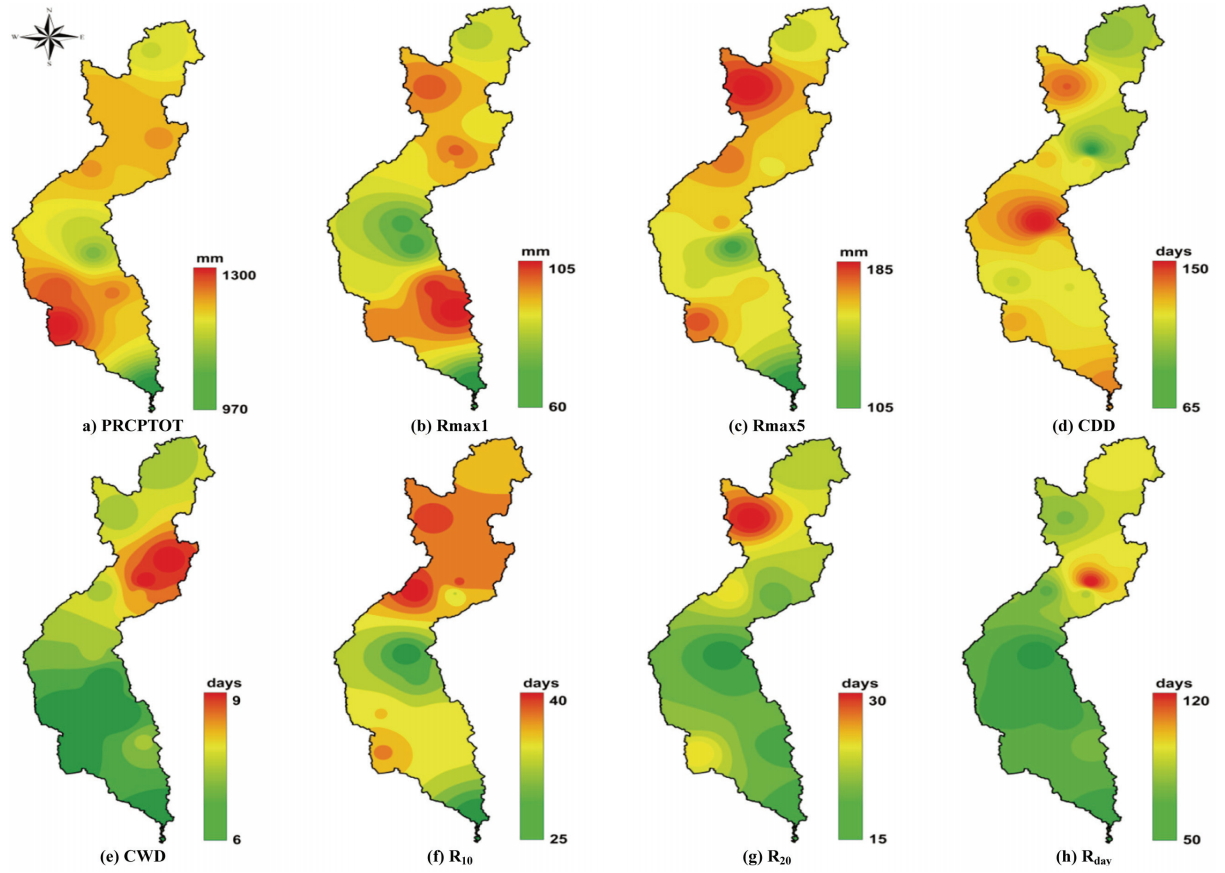
short-term of mean climatology over the Yom river basin
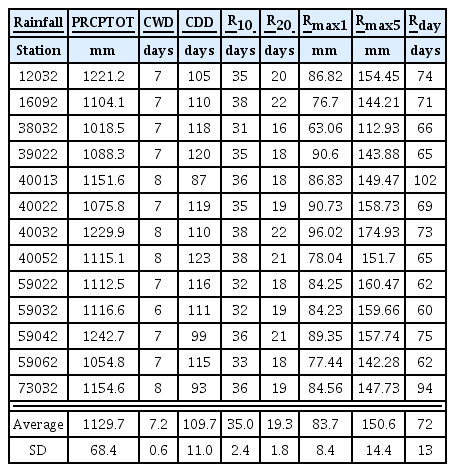
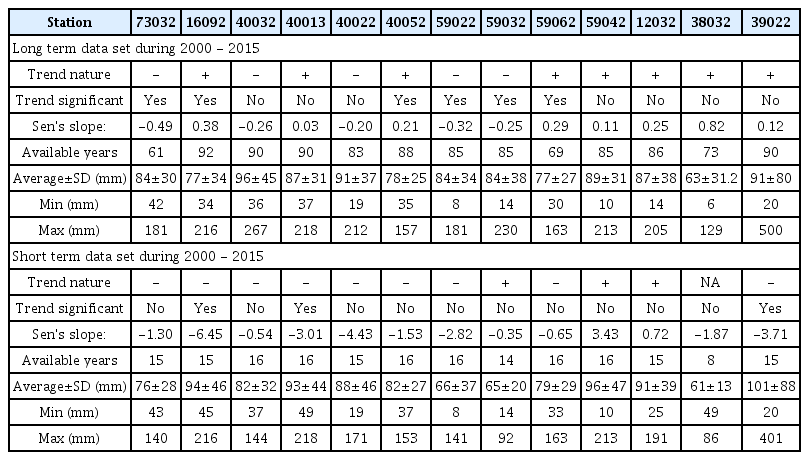
Annually Average Rainfall Indices during the Period 1921-2015 (long-term)
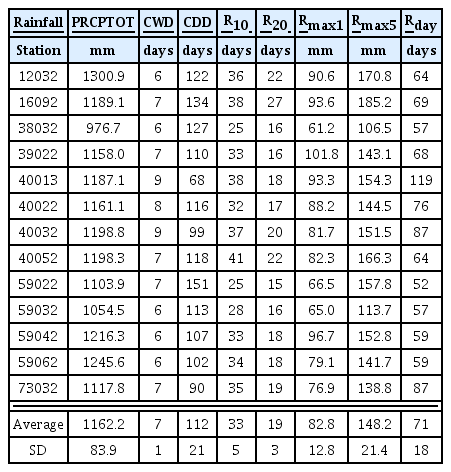
Annually Average Rainfall Indices during the Period 2000-2015 (short-term)
4.1 Trend in Rainfall
Long-term and short-term trends of annual rainfall (PRCPTOT) at 13 stations over the Yom River basin are listed in Table 5, and the variation of the annual rainfall of each station is plotted in Fig. 4. It appears that approximately 62% of the Yom River basin area, which is mainly located in the upper Yom River basin, had an insignificant decrease trend over the long-term period. Approximately 18% of the basin area had an insignificant increase long-term trend. The significant increase trend in annual rainfall during the past 60 years was found at two locations (Stations 16092 and 59062) situated at the western part of the upper and lower Yom River basins (Fig. 1), and the trend is likely to continue. Results from short-term rainfall data analysis indicate that the annual rainfall of approximately 69% of the basin area was insignificant decrease during the period 2000-2015, and the annual rainfall reduction occurred mainly in the upper Yom River basin. However, only 17% of the basin area (mainly located in the lower Yom River basin) had an increase in annual rainfall with an insignificant trend during the past 15 years. However, a significant reduction in annual rainfall between 2000 and 2015 was found at Station 40052. Station 40052 is located in the middle of the Yom River basin, which records information for approximately 8% of the basin.
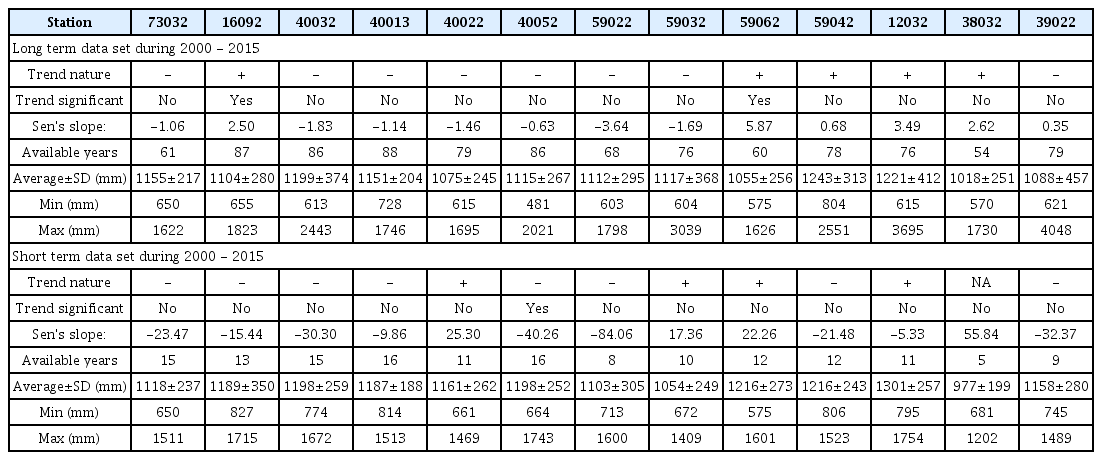
The Detail of PRCPTOT Indices
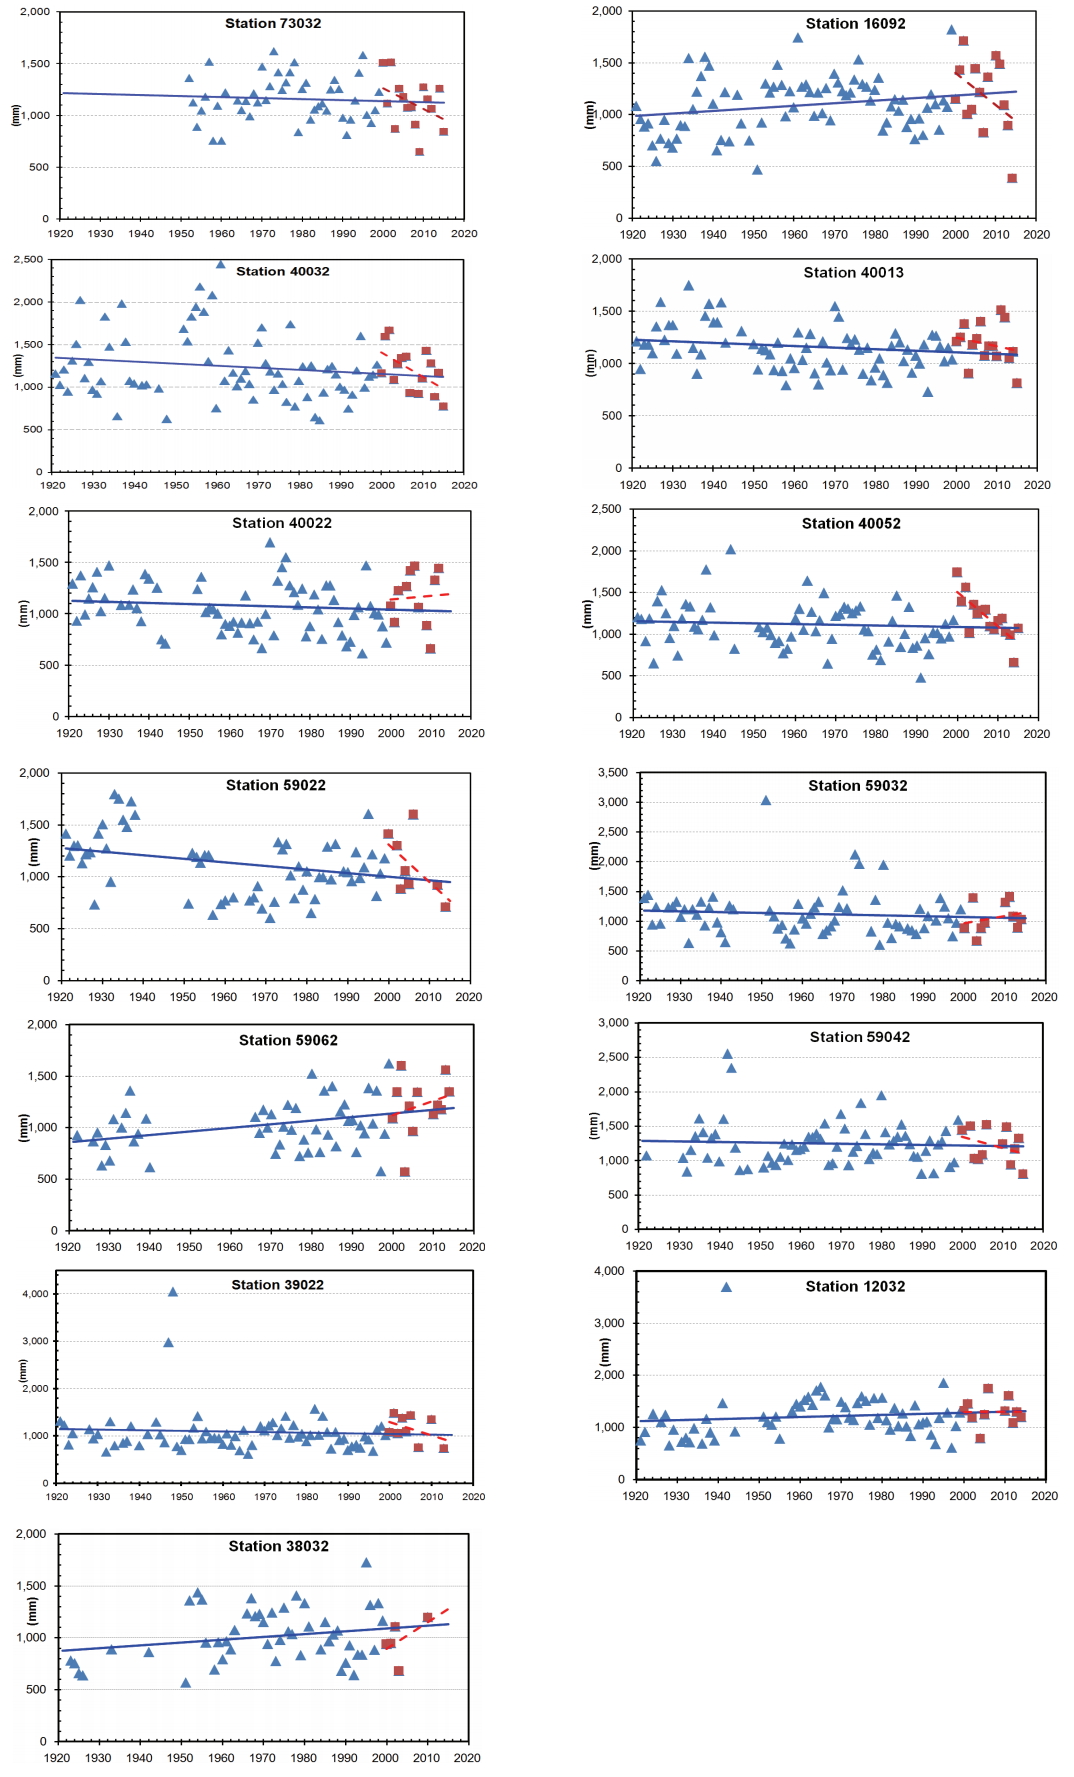
Long term trends (blue line) and short term trend (red line) of annual precipitation total for 13 stations.
Even through only a few stations show statistical significance in their long-term trends, Sen slopes for those stations vary from 17.36 to – 84.36, meaning that the abrupt changes in annual rainfall that occurred during the past decade have a higher degree than those that occurred during the past century.
4.2 Trends in Extreme Rainfall Events
Trends in extreme rainfall indices were analyzed at each hydrological station to assess changes in frequency and intensity of rainfall-related extreme events. Results from extreme rainfall indices in the Yom River basin are discussed below.
4.2.1 Rainfall Intensity
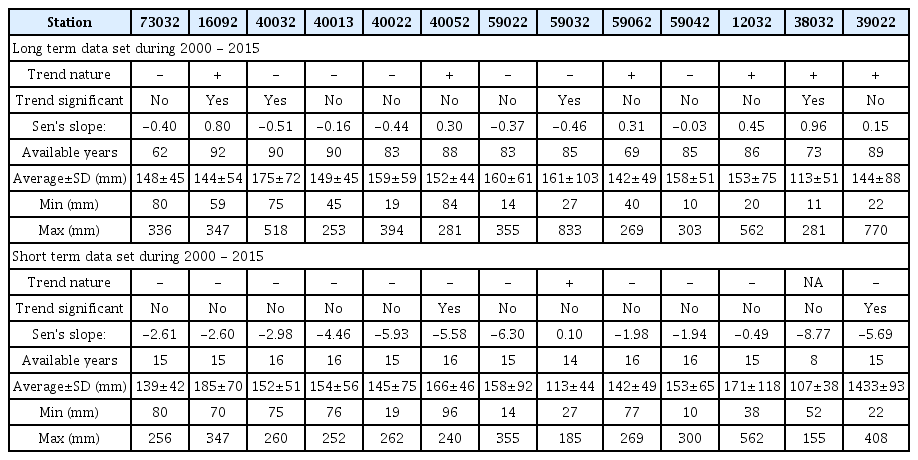
The daily annual maximum rainfall (Rmax1) and the 5 daily annual maximum rainfall (Rmax5) indices give an indication of the trends in rainfall amounts, which usually come from extreme weather events. Any significant changes in these indices may correspond with severe damage in the Yom River basin due to facilities that are insufficient to deal with water-related extreme events in this area. Results from trend analyses for Rmax1 and Rmax5 are shown in Tables 6 and 7, respectively. It appears that the Rmax1 in the study area varied from 63.1 to 96.0 mm/year for the long-term period and from 61.2 to 104.7 mm/year for the short-term period. The average of 5 daily annual maximum rainfall ranged from 112.9 to 175.0 mm/year and 113.7 to 185.2 mm/year during the long- and short-term periods, respectively.
The Detail of Rmax1 Indices
The Detail of Rmax5 Indices
Based on trend of significance values of Rmax1 in Table 6, it appears that a significant increasing trend in rainfall intensity or extreme events during the past century was found along the western part of the Yom River basin covering approximately 28% of the total basin area. Meanwhile, approximately 32% of the basin area located along the eastern part of the basin has an increasing rainfall intensity during the same period. During the past decade, it was found that approximately 86% of the basin area has experienced an insignificant decline of rainfall intensity due to extreme events.
The majority Rmax5 trend shown in Table 7 is similar to trend of Rmax1. However, the significance of either increase or decrease trends in rainfall intensity analyzed from Rmax5 covers less areas than from Rmax1 for the long-term period. Only 16% of the basin area has a significant decrease trend in rainfall intensity over the recent years.
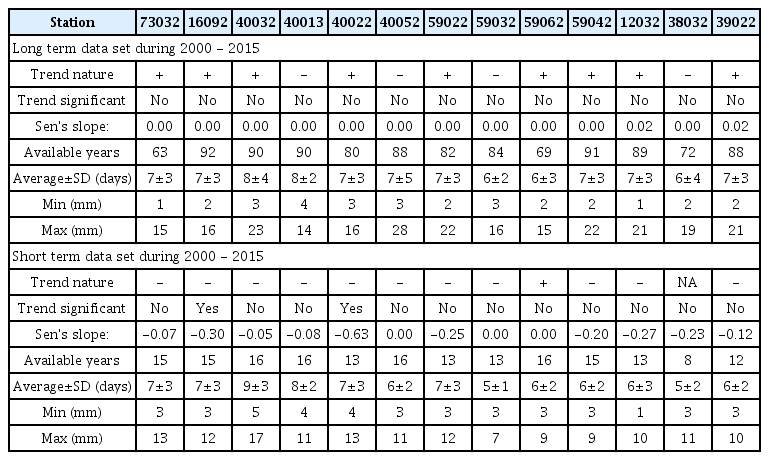
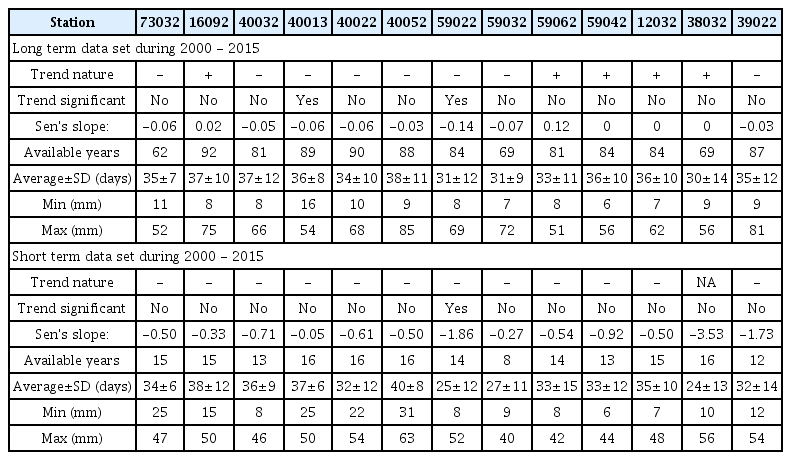
4.2.2 Wet, Dry, and Rainy Days
The maximum consecutive dry days (CDD) and maximum consecutive wet days (CWD) indices describe the duration of dry and wet period, respectively. In general, the CDD and CWD always show an opposite trend. Results of trend tests of CDD and CWD indices for the Yom River basin are presented in Tables 8 and 9, respectively.
The Detail of CDD Indices
The Detail of CWD Indices
Regarding the Table 8, the decreasing trend in dry duration was found in 56% of the total basin scattered across the Yom River basin during the period 1921-2015. However, only 13% of the basin area has a statistically significant reduction of dry period. However, during the past 15 years, the insignificant increase of dry duration was found in as much as 70% of the Yom River basin, and about 20% of the basin has a significantly increase trend in dry period.
For the wet duration, Table 9 shows that the increasing trend in wet duration was found in 77% of the basin area over the past century, whereas the decrease trend in the wet period was mainly found in the lower Yom River basin. However, the change in wet duration over the long-term period is not statistically significant. During the past decade, an insignificant decrease trend in wet duration was found in most of the whole basin. However, only 15% of the total area located in the upper Yom River basin has a significant reduction in wet duration.
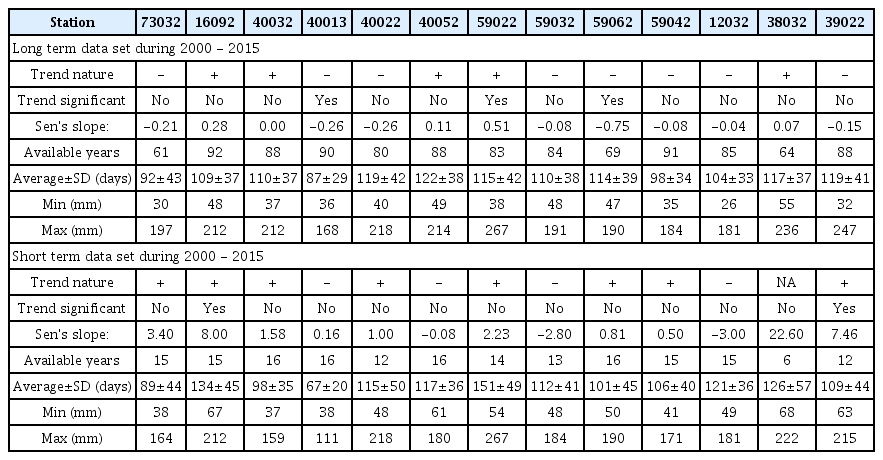
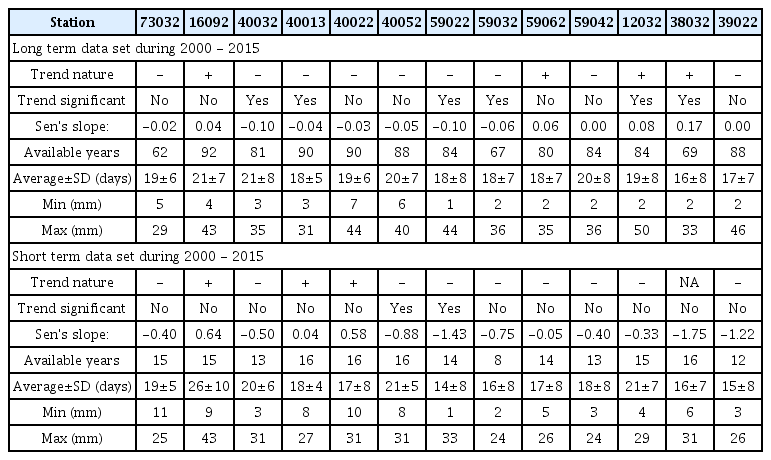
The number of total annual rainy day (Rday, rainfall >1 mm) indices provide information of the wetness of the area. Results of trend analysis on Rday is summarized in Table 10. The results indicate that the whole area of the upper Yom river basin has an increasing trend of annual rainy days during the period 1921-2015, but only 4% of the area has a statistically significant increase trend. In the lower Yom River basin, the annual rainy days is statistically significant, reducing in 44% of the lower Yom River basin area duringthe last century. However, most of the whole area of the Yom River basin has experienced the reduction of rainy days during the period 2000-2015 with a statistically significant decrease trend found at the middle of the basin.

The Detail of Rday Indices
4.2.3 Heavy and Extreme Rainfall Days
The number of heavy rainfall days (R10, Rainfall>10 mm) and the number of very heavy rainfall days (R20, Rainfall>20 mm) are defined by the number of maximum consecutive days with rainfall greater than 10 mm/day and rainfall greater than 20 mm/day, respectively, occurs during a year. The spatial trends of the R10 and R20 indices are presented Tables 11 and 12, respectively. The results in Table 11 indicate that approximately 62% of the basin mainly located in the upper Yom River basin has a decreasing trend in number of the days with heavy rainfall, and the extreme events are found to decrease significantly in 17% of the whole basin area over the period 1921-2015. Meanwhile, the rainfall extreme events seem to insignificantly increase in the lower Yom River basin during the same period. From 2000 to 2015, the rainfall extreme events decreased insignificantly for the whole river basin.
The Detail of R10 Indices
The Detail of R20 Indices
Based on trend analysis of the R20 in Table 12, the occurrence of rainfall extreme events seems to decrease over the upper Yom River basin during the past century. However, the rainfall extremes increased significantly at the most southern part of the Yom River basin during the same period. Similar to the trends in R10, more than 90% of the basin area has a reduction in rainfall extreme events, especially in the lower Yom river basin during the past 15 years.
5. Conclusions
This study was conducted to determine long-term (1921-2015) and short-term (2000-2015) trends in rainfall indices for 13 rainfall stations covering the Yom River basin. The non-parametric statistics test, Mann-Kendall method, was applied to detect eight rainfall indices events, which are the annual precipitation (PRCTPOP), consecutive dry days (CDD), consecutive wet days (CWD), number of heavy rainfall days (R10), number of very heavy rainfall days (R20), daily maximum rainfall (Rmax1), five-day maximum rainfall (Rmax5), and annual total rainy day (Rday).
The PRCTPOP indicator shows that an increasing trend of annual rainfall mainly occurred in the lower part of the Yom River basin. Meanwhile, a decreasing trend of the annual rainfall was found in the upper part of the basin. The analyses of Rmax1 and Rmax5 indices reveal that approximately 28% of the total area of the Yom River basin, located in the western part of the basin, has had a significant increasing trend in rainfall intensity or extreme events during the past century. Meanwhile, decrease of rainfall intensity or extreme events was found along the eastern part of the basin covering 32% of the Yom River watershed. The results also indicate that rainfall intensity due to extreme events is insignificantly decreasing in more than 80% of the total basin area during the past 15 years.
Based on the analyses of CDD, CWD, and Rday indices, which define duration of wet and dry periods, it appears that the dry duration of more than 55% of the Yom River basin is seemingly decreasing during the period 1921-2015. However, during the past 15 years, approximately 70% of the river basin has experienced an insignificant increase of dry duration. The results also show that an increasing trend in wet duration was found in 77% of the basin area during the past century except in the lower Yom River basin where the decrease trend in wet period was found. Nevertheless, wet duration of the whole basin is insignificantly decreasing during the past decades. Results of trend analysis on Rday indicate that the annual rainy days of the areas located in the upper Yom river basin has insignificantly increased during the period 1921-2015, but the significant decrease of annual rainy days was found in 44% of the lower Yom River basin area. It was also found that during the period 2000-2015 a statistically significant decrease trend was found only at the mid of the basin.
The results from the analyses of number of heavy rainfall (R10 and R20) suggest that the occurrence of rainfall extreme events is likely decreasing over the upper Yom River basin during the past century. Meanwhile, the significantly increasing of rainfall extremes was found at the lower Yom River basin. It also found that rainfall extreme events have decreased in more than 90% of the basin area, especially in the lower Yom river basin during the past 15 years.
Based on the results analyzed from the eight rainfall indices, it can be concludedthata significantly increasing tendency of flooding was found along the western part of the Yom River basin where the effective drainage capacity is limited. Furthermore, the results also suggest that the occurrence of drought tends to increase in the middle portion of the Yom river basin. The information from this study may be helpful for improving water resources planning including flood/drought management in the Yom River basin.
Acknowledgements
This research was supported by a grant (18AWMPB079625-05) from Water Management Research Program sponsored by Ministry of Land, Infrastructure and Transport of Korean government.