


1. 서 론
1.1 연구의 배경 및 목적
최근 급격한 기후변화 현상은 전 세계적으로 자연재해현상을 야기하며 범세계적 차원의 문제로 나타나고 있다. 우리나라에서도 급격히 늘어난 국지성 호우나 지진, 폭염 등 각종 재해로 인한 피해가 급증하고 있는 실정이다. 대표적인 예로, 2011년 7월 서울 서초구 우면산 지역의 집중호우로 인한 붕괴사태는 다수의 사상자와 311억원에 달하는 재산피해를 가져왔으며 2000년대 이후 서울시에서 발생한 역대 최악의 참사 중 하나로 기록되고 있고 이로 인해 자연재해의 위험성에 대한 국민들의 인식이 증대하였다.
이에 행정안전부에서는 자연재해대책법을 수립하며, 자연재해로 인한 노출정도가 높은 지역에 대하여 자연재해위험개선지구(이하 재해위험지구)를 지정토록 하고 있다. 재해위험지구는 지정과 함께 정비계획을 함께 수립토록 하고 있으며, 이를 통하여 해당 지구의 유형, 여건 및 재해발생빈도 등을 고려한 정비사업을 실시토록 하고 있다. 서울특별시에서는 1996년 녹번동 일대 붕괴위험지구 지정을 시작으로 현재까지 16개 지구가 지정되어 왔으며, 그 중 6개소가 정비사업 완료 후 해제되어 10개 지구가 남아있는 상태이다. 가장 최근 지정된 자연재해 지구는 2012년 종로구 일대로써, 이를 마지막으로 서울시에서는 추가적인 재해위험지구의 지정이 이뤄지지 않고 있다. 또한 재해위험지구의 공간적 경계를 살펴보면 대체로 산지, 하천 등의 자연재해 발생지에 지정되며, 자연재해로 인한 실질적인 피해가 나타날 수 있는 주거지역은 포함하지 않고 있다. 서울시는 높은 밀도를 지니고 있어 자연재해발생시 높은 피해가 예상되는 지역이나, 최근 증가하고 있는 자연재해 빈도에 비추어 볼 때 현재 서울시에 지정된 재해위험지구의 관리면적은 증가하는 자연재해의 위험을 예방하기에는 빈약한 수준으로 볼 수 있다.
재해위험지구 지정의 부진함은 지구지정에 대한 주민들의 낮은 기대감(Kim et al., 2016)과 부동산가치 하락에 대한 우려(Koo and Lee, 2015)를 주요 원인으로 볼 수 있다. 감사원(The Board of Audit and Inspection of Korea, 2010) 보고서에 따르면, 자연재해 재발우려지역 임에도 불구하고 부동산 가격변동 등에 대한 주민민원 때문에 담당부서에서는 자연재해위험지구를 지정하지 못하는 일이 발생하고 있다. 주민들의 우려와 같이, 자연재해 발생은 자산 가치의 평가 기준을 변화시킨다. 자연 재해로 인해 부동산 자산이 손상되면 이에 대한 복구비용과, 피해가 반복될수록 유지 및 보수비용도 추가적으로 증가하게 된다(Koo and Lee, 2015). 부동산 구매 시, 이러한 재해 이력과 미래 재발 위험을 고려하는 구매자들이 증가하고 있으며(Harrison et al., 2001), 재해 예방을 위한 지구지정은 대상지역을 재해지역으로 인식시킴으로써 지가 하락을 유발 할 수 있다(Yoon, 2017). 하지만, 일부 연구들에서는 재해위험지구 지정에 의한 정비사업 후의 긍정적인 결과를 주장하고 있으며, 오히려 지가상승에 기여할 수 있음을 보여주고 있다(Lamond and Proverbs, 2006; Daniel et al., 2009; NDMI, 2012; Atreya and Czajkowski, 2016; Jung and Yoon, 2017).
이와 같이 재해위험지구가 부동산가격에 미치는 영향에 대한 상반되는 주장에도 불구하고, 관련 실증 연구는 미흡한 실정이다. 따라서, 본 연구는 서울시를 대상으로 재해위험지구의 지정 및 정비사업이 부동산가격에 미치는 영향을 실증분석하는 것을 목적으로 한다. 이를 통해 점차 빈번해지고 있는 자연재해 위험성 예방을 위해 효율적인 재해위험지구 지정에 대한 시사점을 제공하고자 한다.
1.2 연구의 범위 및 흐름
본 연구는 현재 지정되어 있는 서울시 재해위험지구 및 인근지역을 공간적 범위로 하며, 재해위험지구 인근 부동산 가격의 시간적, 공간적 변화 정도를 살펴봄으로써 재해위험지구 지정의 부동산가격에 대한 영향을 진단한다. 또한, 재해위험지구가 주변 부동산가격에 미치는 영향정도를 분석하기 위한 사례 지구와 영향권을 설정한다. 이를 대상으로 헤도닉 가격함수(Hedonic Price Function) 모형을 구축하여 분석을 실시한다. 모형분석의 시간적 범위는 부동산 실거래가(아파트) 데이터의 구득 가능성을 고려하여 2006년~2017년도로 설정하였다.
2. 선행연구 검토
2.1 자연재해위험개선지구 관련 제도 검토
도시지역 재해피해가 증가하면서 국토교통부는 풍수해, 산사태, 지반의 붕괴 등 자연재해에 취약한 지역에 대하여 방재지구 지정을 의무화하고 있다(Lee et al., 2018). 이와 관련하여 「자연재해대책법」에 따르면 각 지자체 재해위험지역에 대한 적극적인 재해예방사업을 지원하기 위하여 재해위험지구 제도가 시행중에 있으며 자연재해의 종류에 따라 침수위험지구, 유실위험지구, 고립위험지구, 취약방재시설지구, 붕괴위험지구, 해일위험지구 등 6개 유형으로 구분된다. 침수위험지구는 하천의 외수범람 및 내수배제 불량 등으로 인한 침수피해가 발생되었거나 예상되는 지역을 대상으로 지정되며, 유실위험지구는 하천을 횡단하는 교량 및 암거구조물이 관련 계획의 하폭보다 짧거나, 계획홍수위보다 낮아 피해가 발생하였거나 예상되는 지역을 대상으로 지정된다. 고립위험지구는 집중호우 및 대설로 인한 교통두절의 위험이 있는 지역, 취약방재시설지구는 저수지⋅댐, 기 설치된 제방, 배수문 등이 관련 법률기준에 미치지 못하거나, 노후화되어 재해발생이 우려되는 지역에 지정된다. 산사태로 인한 인명피해가 예상되는 지역은 붕괴위험지구, 지진해일, 폭풍해일 등 각종 해일로 인한 피해가 예상되는 지역은 해일위험지구로 지정된다.
재해위험지구는 1998년부터 지방자치단체 재해예방사업의 주요 수단으로 활용되어 왔다. 그러나 다양한 공공시설 및 공공서비스의 연계를 원하는 거주민의 입장이 고려되지 못하였으며, 단순 예방시설 설치에만 초점을 맞춘 공급자 중심의 예방사업으로 시행되어 왔다(Kim et al., 2016). 또한 재해위험지구의 지정이 기존 피해지역 위주로만 지정되고 단위시설물 위주의 정비로 인하여 시설물간의 기능연계가 미흡한 상황이다(Lee et al., 2018). 이러한 공급자 중심의 예방사업은 거주민의 실제 요구를 충족시키지 못해 실질적인 주거만족도에 큰 영향을 미치지 못했다.
지구지정과 관련하여 국립방재연구원(NDMI, 2012)에 따르면, 재해위험지구 정비사업 대상지 거주민들을 대상으로 설문조사를 진행한 결과, 재해위험지구 정비 사업에 대한 필요성은 충분히 인식하고 있으나 대상지 선정 형평성에 대한 불만족이 상당히 높은 것으로 나타났다. 또한 정비사업의 효과인식 측면에서 체감안전도 변화, 지역경제 활성화, 지가상승 기대감 등에 대하여 보통이하의 인식을 보이고 있다(NDMI, 2012; Kim et al., 2016). 특히. 자연재해가 거주민의 인명과 재산피해에 직결되는 문제임을 고려할 때 자연재해 위험지역이라는 정보는 잠재적 부동산 구매자들에게 부정적으로 작용하여 지가하락을 유도하게 된다(Koo and Lee, 2015).
그러나 국립방재연구원(NDMI, 2012)에 따르면 정비사업의 비용/편익비가 평균 3.0으로 나타났으며 이 결과는 정비사업을 실시하지 않았을 경우에 발생할 피해액보다 약 3.0배 효과가 있음을 의미한다. 또한 재해위험지구 정비사업 실시 후 설문조사를 시행한 결과, 지역경제 활성화 및 지가상승기대 정도가 보통 이상으로 개선되는 결과가 나타났다(NDMI, 2012; Kim et al., 2016). 이러한 연구결과를 종합하면 재해예방형 도시계획의 측면에서 재해위험지구 지정이 필요하나 지가하락 및 사업결과에 대한 우려로 효과적인 정책시행 등에 어려움을 겪고 있는 상황으로 볼 수 있다. 즉, 재해위험지구 지정과 관련하여 부동산가격 및 지역경제에 미치는 영향에 대한 정량적 분석이 필요하며, 이러한 결과를 바탕으로 재해위험지구 사업방식, 사업내용 등 폭넓은 논의가 필요한 시점이다.
2.2 자연재해와 부동산 가격
자연재해와 부동산가격 사이의 관계는 다수의 선행연구에서 부정적인 영향을 미친다는 결과가 도출되고 있다. 이러한 결과는 잠재적인 주택구매자들이 재해 발생지역에 대하여 유지⋅복구비용을 인식하여 해당 부동산 구매를 기피하거나(Zhang et al., 2010; Ismail et al., 2016) 재해 위험도에 따라 보험료 증가의 부담감이 지역 내 부동산 가격에 부정적인 영향을 미치는 것으로 추정된다(Bin et al., 2008). 국내에서도 자연재해로 인한 피해와 잠재적 위험지역이라는 인식으로 인해 해당 지역의 부동산 가격이 감소된다는 결과가 도출되어 왔다(Choi and Song, 2013). 반면 강변이나 산림 인접지역 등 자연재해 위험지역으로 지정된다고 하여도 복구 및 재해예방사업을 통해 해당 지역의 여건이 개선된 경우에는 재해위험 여부가 더 이상 부동산 가격에 영향을 미치지 않게 되며(Lamond and Proverbs, 2006) 오히려 강변이나 산림 인접지역이 경관 프리미엄으로 작용하여 부동산 가격과 양의 상관관계를 보이기도 한다(Daniel et al., 2009; Atreya and Czajkowski, 2016; Jung and Yoon, 2017).
위에서 제시한 상반된 연구결과는 자연재해와 부동산 가격 간의 관계분석은 분석시점에 대한 고려가 필수적임을 시사한다. Jung and Yoon (2017)은 우면산 산사태 자연재해를 사례로 자연재해가 인근 부동산 가격에 미치는 영향을 파악하였다. 분석결과, 자연재해 발생지점으로부터 250 m와 500 m 이내의 권역에서 매매가격이 각각 15.5%, 14.3% 낮게 나타났으나 재해 예방사업 6개월 이후부터 12개월까지 평균 매매가가 상승하여 12개월 지난 뒤부터는 오히려 대조군보다 비싸지는 결과가 나타났다.
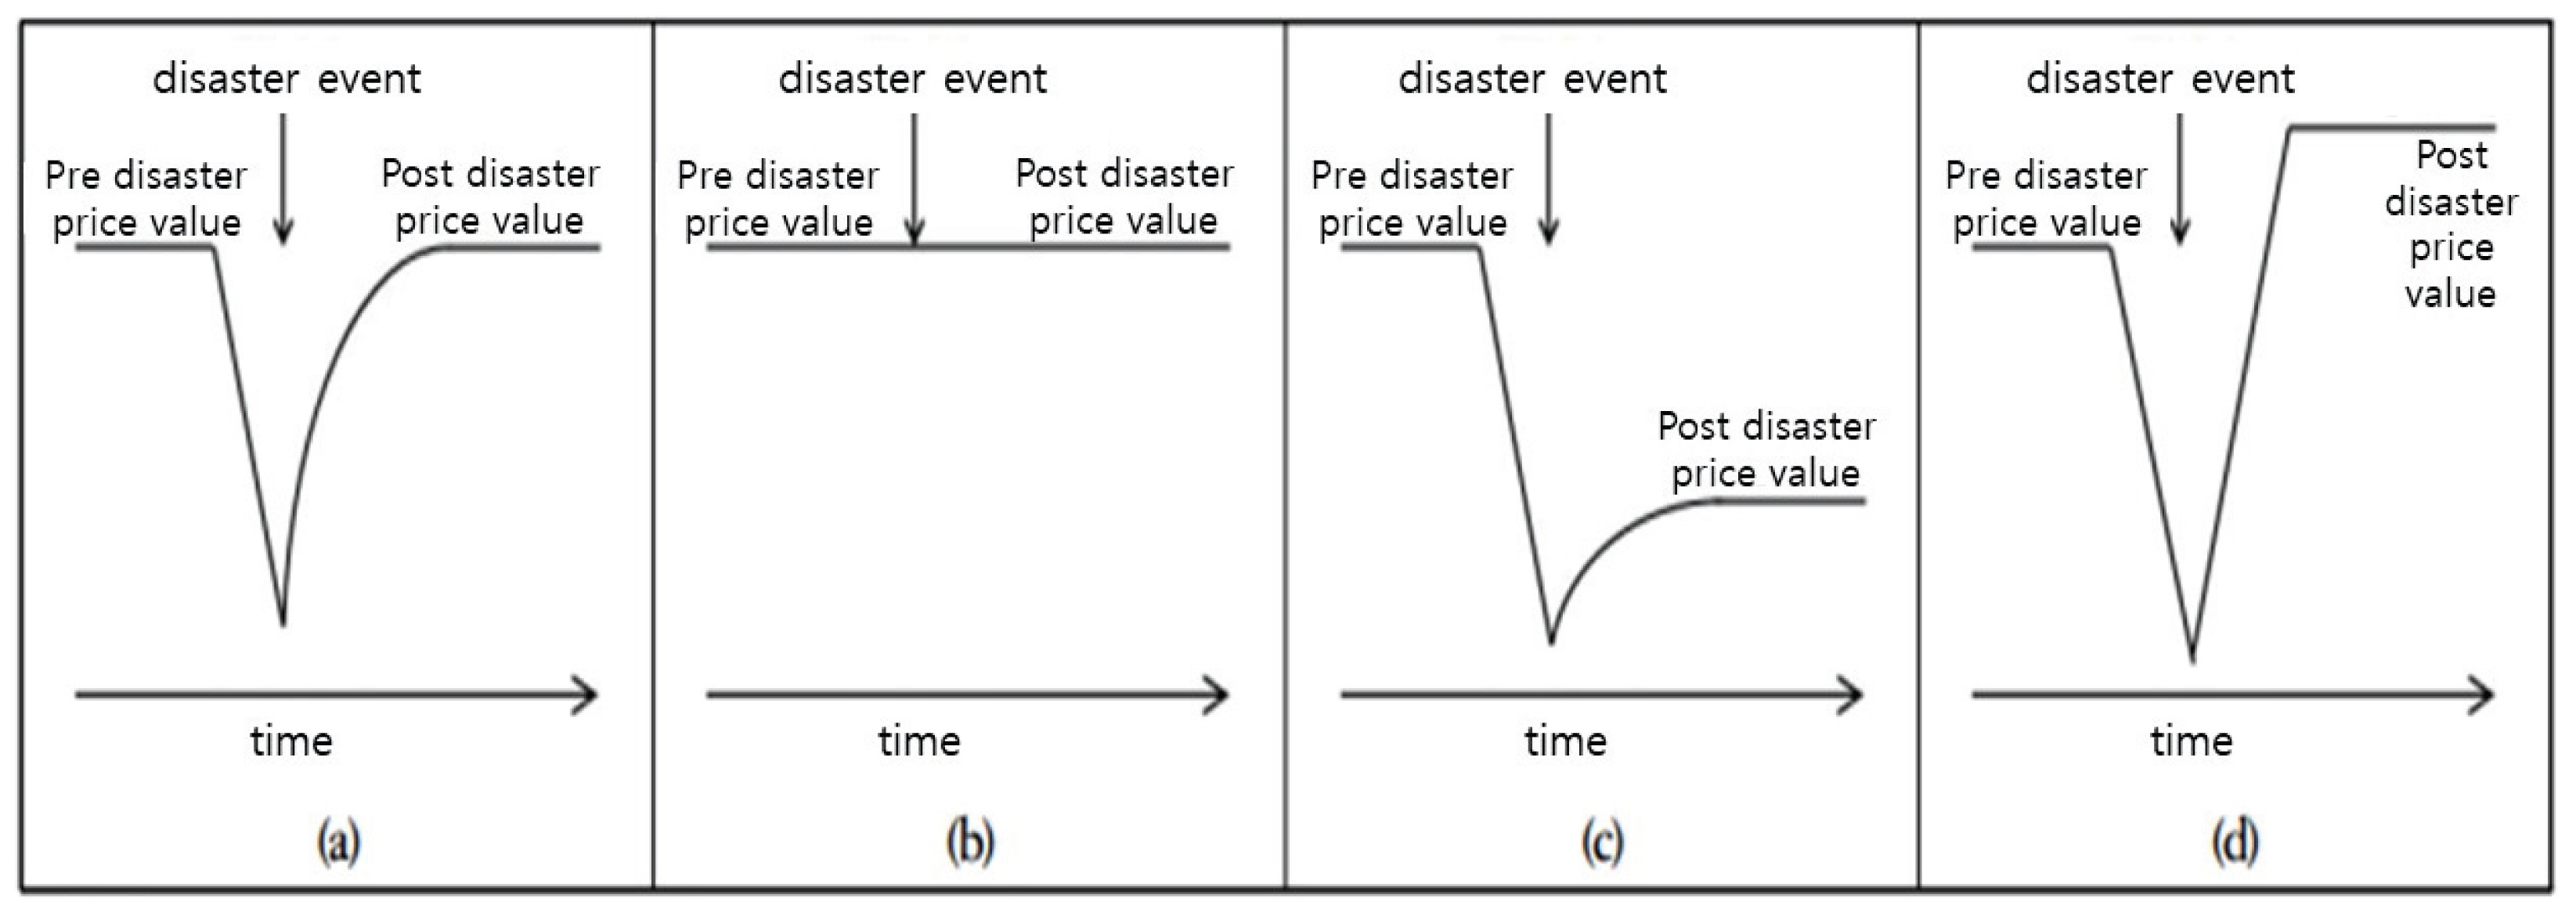
Lamond and Proverbs (2006)는 위에서 제시한 연구결과와 같이 자연재해와 부동산 가격의 관계가 시간이 흐름에 따라 Fig. 1과 같은 유형으로 나타날 수 있음을 주장하였다. (a)유형의 경우 재해 발생 후 일시적 가격하락이 있으나 복구사업 이후 원래의 가격이 회복되는 유형을 의미하고 (b)유형의 경우 재해가 자주 발생하는 지역으로써 이미 재해에 대한 인식이 부동산 가격에 포함되어 있는 형태이므로 영향을 미치지 않는 유형, (c)유형의 경우 재해 발생으로 잠재적 주택 구매자들의 인식이 하락하여 부동산 가격이 회복되지 못하는 경우, (d)유형은 재해발생 후 부동산 가격이 일시적으로 하락했다가, 개선사업이 진행된 후 더욱 높은 가격으로 형성되는 경우를 의미한다.
대다수의 선행연구에서 (c)유형과 같은 자연재해 발생 전후 시점을 활용하여 자연재해가 부동산 가격에 미치는 영향을 분석하고 있으나 (a)유형, (d)유형과 같이 재해발생 이후 시간의 흐름에 따른 지역 부동산 가격 변화에 대한 분석은 매우 부족한 상황이다. 특히, 재해예방형 도시계획의 실현 및 관련 정책의 효과적인 시행을 위하여 재해위험지구 제도와 지역경제 및 부동산 가격에 대한 실증연구가 충분하지 못하다.
자연재해와 부동산 가격의 관계를 특정 시점에서만 분석하면 주택시장에 대한 영향력의 변화 및 변동추이를 파악할 수 없는 한계점이 있다(Koo and Lee, 2015; Rajapaksa et al., 2016; Jung and Yoon, 2017). 즉, 재해위험지구의 지정과 재해예방사업의 시행효과를 실증적으로 분석하기 위해서는 해당 지역의 부동산 가격과 재해위험지구에 대한 장기간의 시계열적 자료를 이용하여 파악하여야 함을 의미한다.
3. 연구의 방법
본 연구는 재해위험지구가 부동산가격에 미치는 영향을 분석하는 것을 목적으로 하며, 부동산가격의 측정은 균일한 조건의 주택유형에 대한 가격 측정을 위해 아파트 실거래가를 기준으로 한다. 이를 위하여, 높은 인구밀도와 함께 가장 높은 부동산 가격을 지니고 있어 재해위험지구의 영향이 가장 민감하게 나타날 것으로 예상되는 서울특별시를 공간적 범위로 연구를 진행한다. 서울시 내 지정된 재해위험지구의 현황분석을 통해 모형 적용을 위한 분석 대상지를 선정하며, 분석대상지 인근 아파트 실거래가를 종속변수로 하는 헤도닉가격모형을 구축하여 재해위험지구가 인근 지역 부동산 가격에 미치는 영향을 분석한다.
3.1 서울시 자연재해위험지구 현황 및 분석대상지 선정
서울시 내 지정되어온 재해위험지구는 Table 1과 같다. 서울시 내에는 16개 재해위험지구가 지정되어 왔으며, 그 중 2000년도 이전에 지정된 6개 지구는 정비사업 완료와 함께 해제되어 현재 10개 지구가 남아 있는 상태이다. 유형별로는 재해위험지구의 6개 유형 중 2개 유형(붕괴위험지구, 침수위험지구)만이 지정되어 왔으며, 현재는 각각 3개소, 7개소가 지정되어 있다. 현재 남아 있는 재해위험지구는 강서구 3개소, 서초구 4개소, 양천구, 용산구, 종로구 내 각 1개소이며, 종로구 내 침수위험지구를 제외하고는 모두 가장 높은 위험등급인 가등급으로 분류되어 있다.
본 연구에서는 국토교통부에서 제공하고 있는 재해위험지구 필지정보를 활용하여, 재해위험지구의 위치 및 경계를 식별한다. 정비사업 완료로 지구지정이 해제된 6개 지구를 제외한 10개 지구 중 서초1동 1327 일대 침수위험지구를 제외한 9개 지구에 대한 자료가 제공되고 있으며, 9개 지구 중 세부 데이터의 구득여부, 재해위험지구의 면적 및 유형 등을 고려하여 분석대상지를 설정한다. 데이터의 구득여부는 우선적으로 본 연구의 주요 변수인 부동산 실거래가 변수의 시간적 범위를 고려한다. 부동산 실거래가 변수는 국토교통부 실거래가 공개시스템에서 제공하고 있는 아파트 실거래가 자료를 활용하였으며, 최초 공개 년도는 2006년부터로 제한되어 있다. 본 연구에서는 이를 고려하여 2006년도 이후 지정된 재해위험지구 중에서 분석 대상지를 선정하였다. 이어서, 붕괴위험지구, 침수위험지구 별로 재해위험지구의 지리적 파급효과가 클 수 있는 가장 큰 면적을 지니고 있는 지구를 각각 선정하였다. 이러한 기준 하에, 우면산 붕괴위험지구와 한강로 침수위험지구를 모형분석의 대상지로 선정하였다.
우면산 붕괴위험지구는 2011년 7월 우면산 산사태 발생과 함께 같은 해 10월에 지정된 지구로써, 지정 직후부터 이듬해 8월까지 복구공사가 진행되었다. 이 후 산사태 복구지 경관복원사업이 매년 진행되어 오고 있다. 한강로 침수위험지구는 2010년 9월 한강로 일대 침수 발생 이후, 다음 해인 2011년 3월에 지정된 지구이다. 지정과 함께 빗물펌프장, 배수관로 시설 등의 도시계획 사업이 시작되었으나, 2014년 빗물펌프장 설치에 따른 지역주민들의 집단민원이 발생하여 설치부지이전 등의 난항을 겪었다. 이듬해 2015년부터 한강로 일대 방재시설 확충사업 공사가 재개되어 최근에 사업이 완료되었다.
3.2 자연재해위험개선지구가 아파트 가격에 미치는 영향 범위 설정
재해위험지구의 인근 지역 아파트 가격에 미치는 영향을 분석하기 위한 영향 범위는 최근 관련 선행연구를 가반으로, 분석대상 지구를 기준으로 버퍼(buffer)를 설정하여 인근 1,000 m 내 실제 매매 거래가 있었던 아파트로 한정하였다. 이남석 외(Lee et al., 2016)는 일반적인 역세권 범위인 500 m~1,000 m와 연구의 주요 관심사인 부산시민공원의 규모(850 m × 550 m)를 고려하여 공원 인근 1,500 m 내 부동산을 영향권역으로 설정하였으며, Jung and Yoon (2017)은 1,000 m 까지의 부동산을 우면산 산사태의 영향권역으로 설정한 바 있다. 이에 본 연구에서는 공간적 범위가 일부 유사한 정은아⋅윤희연의 영향범위를 적용하여 영향권역을 해당 지구 경계로부터 1,000 m 내로 설정하였다.
해당 권역과의 비교를 위하여 인근 1,500 m 까지의 부동산을 분석 범위 내에 함께 포함하였으며, 범위 내 아파트 실거래 데이터를 구축하였다. 한강로 침수위험지구의 경우 한강 이남의 강남지역은 침수위험지구의 영향권 내에 있다고 보기 어려우므로 분석 범위에서 제외하였으며, 우면산 붕괴위험지구 역시 인근 1,500 m 지역 내 포함된 경기도 지역은 분석범위에서 제외하였다. 서초구는 남부순환로를 기준으로 남측과 부측의 주거여건이 상이함으로 북측에 위치한 아파트 단지만을 분석 범위에 포함하였다. 본 연구의 분석대상지구 및 인근권역은 Fig. 2와 같다.
3.3 모형 및 변수
재해위험지구가 부동산 가격에 미치는 영향을 분석하기 위하여 본 연구에서는 2006년~2017년 아파트 실거래가의 면적(m2)당 가격을 종속변수로 하는 다중회귀모형을 구축하였으며, 2017년을 기준으로 아파트 실거래가를 현가로 환산하였다. 본 분석모형은 헤도닉 주택가격모형을 기반으로, 주택가격에 영향을 미칠 수 있는 변수들을 설명변수로 포함하였다. 일반적인 헤도닉 주택가격모형은 주택의 물리적 특성, 주택지 인근 특성, 주택의 접근성을 주요 변수로 포함한다. 본 연구에서는 주택의 물리적 특성으로 거래된 주택의 전용면적, 해당 층수, 거래 당시의 노후도를 포함하였으며, 주택지 인근 특성으로는 해당 아파트 단지의 건폐율, 용적률, 대지면적, 세대수, 단지 노후도, 최고층수 등을 포함하였다. 주택의 접근성 변수로는 입지적인 특성을 보여줄 수 있는 가장 인접한 지하철역, 초등학교, 한강까지의 보행거리 등을 GIS를 통해 네트워크 거리로 측정하여 변수로 사용하였다. 모형 식은 아래와 같으며, 모형 내 변수를 종합하면 Table 2와 같다.
Pi : i 주택 실거래가(만 원/m2)
Hi : i 주택 특성, Ni : i 주택단지 특성
Di : i 주택의 입지적 특성
Bi : i 재해위험지구로부터의 거리 더미 변수
Ti : i 주택의 매매시점 더미 변수
위 식에서 P는 주택 실거래가의 면적 당 가격이며, H는 실거래 해당 주택의 특성, N은 해당 아파트 단지의 특성, D는 입지적인 특성을 의미한다. B는 재해위험지구로부터의 공간적 영향을 측정하기 위한 변수로써, 재해위험지구로부터 거리 버퍼로 구분된 더미변수이다. 거리 버퍼는 재해위험지구로부터 본 연구에서 설정한 영향권역인 1,000 m까지를 200 m 단위로 구분하여 총 5개 버퍼로 구분하였으며, 영향권역 밖으로 볼 수 있는 1,000 m ~ 1,500 m 영역을 더미변수의 기준값으로 설정하였다. T는 재해위험지구의 시간적 영향을 측정하기 위한 변수로, 주택의 거래년도를 더미변수로 포함하였다. 연도별 변화를 측정하기 위하여 아파트 실거래가 변수의 초기년도인 2006년도를 기준값으로 더미변수를 구성하였다. 이와함께, 재해위험지구로부터의 거리 버퍼더미변수(B)와 거래시점 더미변수(T)에 대하여 각각 상호작용 항을 구축하여, 재해위험지구가 인근 아파트 가격에 미치는 시공간적인 영향을 분석하였다.
4. 분석결과
4.1 부동산 가격 변화 추세 분석 결과
Table 3은 분석대상지인 한강로 침수위험지구, 우면산 붕괴위험지구의 연도별 아파트 가격 변화율을 보여주고 있다. 두 지구 인근 아파트 가격은 연평균 4.64%, 4.32%의 증가율을 보여주며 10년간 점차적으로 상승하고 있는 추세로 나타났다. 하지만, 두 지구의 지정년도인 2011년도 이후 약 2-3년간은 전체 인근지역의 평균 아파트 가격 변화율이 음의 값을 보였다. 이는 재해위험지구의 지정이 당시 아파트 가격에 영향을 주었을 가능성을 보여주고 있다. 지구 지정 이후 인근지역 거주민들의 민원으로 인하여 즉각적인 정비사업이 이루어지지 못한 한강로 침수위험지구 인근 아파트 가격은 2011년도 –1.6%를 시작으로 2013년도까지 –7.4%의 변화율을 보이며 감소추세가 점차 심화되었다.
반면에, 지구지정 이후 즉각적인 복구사업이 이뤄진 우면산 붕괴위험지구의 인근 아파트 가격은 지구지정 2011년도에 –2.2%로 소폭 감소하였으나, 이후 감소추세가 점차 회복되는 것으로 나타났다.
각 재해위험지구로부터 거리별로 구분된 지역 내 아파트 가격의 변화율을 살펴보면, 한강로 침수위험지구 인근 아파트 가격은 각 구간별 평균 변화율이 전체 구간 평균 변화율과 대체로 유사하게 나타났다. 하지만, 이를 각 년도 별로 살펴보면, 200 m 내 구간은 2013~2014년에서, 200~600 m 구간은 2012~2013년에서, 600~800 m 구간은 2011, 2013~2014년에서, 800~1,500 m 구간은 2011~2013년도에서 감소추세를 보이고 있다. 해당 시점들은 공통적으로 지구 지정년도인 2011년 이후 약 2~3년간에 포함되는 시점이다. 또한 각 구간은 이러한 감소추세 이후 대체로 아파트 가격이 회복되는 추세를 보이고 있다. 특히, 재해로부터 직접적인 영향을 받을 것으로 예상되는 200 m 이내 지역에서는 침수가 일어난 2010년에는 평균 3.6%의 가격 감소가 있었고, 지구지정 이후 소폭 상승하였으나 빗물펌프장 설치 입지에 대한 갈등이 점화된 2013년과 2014년에는 각각 4.9%와 8.9%로 큰 폭의 가격 하락이 나타났다. 한강로 방재시설 설치가 재개된 2015년 이후에는 비교적 꾸준한 가격 상승세를 보이고 있다. 즉, 아파트 가격이 지구 지정 자체보다는 침수라는 자연재해와 빗물펌프장 설치 등의 사업에 더 민감하게 반응한 것으로 볼 수 있다.
우면산 붕괴위험지구 인근 아파트의 각 구간별 부동산 가격은 200 m 내 구간의 평균 변화율이 2.47%로 가장 낮은 값을 보였으며, 200~400 m 구간은 3.8%로 두 번째로 낮은 변화율을 보였다. 이는 평균 변화율보다 약 1~2% 낮은 상승률로써, 아파트 가격이 시계열적으로 점차 상승하고 있는 추세임을 감안할 때, 아파트 가격에 부정적인 영향이 존재하였음을 보여준다. 특히, 지구와 가까운 지역일수록 그 변화율이 낮게 나타난 것은 우면산 붕괴위험지구 지정 혹은 우면산 산사태로 인한 아파트 가격에 대한 공간적 영향이 인접지역에서 더 크게 나타날 수 있음을 보여주는 분석결과이다. 한강로 침수위험지구 인근 부동산과의 차이점으로는, 각 구간 별 감소추세가 심화되지 않는 것으로 나타났으며, 비교적 빠른 시일 내에 회복되며 2014년도 이후부터는 대체로 지속적인 상승추세를 보이고 있다는 점이다. 이는 서초구라는 입지적 특성과 지구 지정 이후 즉각적인 정비사업의 시행이 아파트 가격 회복에 긍정적인 영향을 가졌을 가능성을 보여준다.
지구지정 이전에도 감소 추세가 존재하는 것과 지구에서 비교적 먼 1,000~15,00 m 구간 내에서도 유사한 추세가 나타났다는 점을 감안할 때, 각 지구 인근 부동산 가격의 감소 및 증가 추세가 재해위험지구의 지정 및 정비사업의 영향을 받았다고 단정 짓기는 어려울 수 있다. 이에, 본 연구에서는 시간적⋅공간적 더미변수를 포함한 모형을 구축하여 재해위험지구의 지정 및 정비사업의 시공간적 영향에 대하여 실증 분석하였다.
4.2 자연재해위험개선지구가 부동산 가격에 미치는 영향
본 연구의 모형에서 사용된 변수의 기초통계량 분석결과는 Table 4와 같다. Tables 5는 재해위험지구가 부동산 가격에 미치는 영향분석 결과이다. 모형 1은 한강로 침수위험지구 인근 부동산 가격(2017년 기준 환산가격)을 종속변수로 하는 모형의 분석결과이며, 모형 2는 우면산 붕괴위험지구의 분석결과이다. 모형 내 각 변수의 계수값은 소수점 4번째 자리까지 표기하였으며, 0.0001로 표기된 계수는 그 미만의 값을 포함한다. 모형에 포함된 주택특성. 단지특성, 입지 특성 변수는 대부분 유의한 값을 가지며 아파트 가격에 영향을 미치는 것으로 분석되었다. 하지만, 아파트노후도, 초등학교와 지하철역까지의 네트워크거리 변수는 두 모형에서 상반되는 부호를 가지는 것으로 분석되며, 두 지역 간 부동산 특성에 차이가 존재하는 것으로 나타났다. 재해위험지구의 영향을 분석하기 위한 거리 더미 변수, 매매년도 더미변수, 두 변수들의 상호작용 항 변수들 또한 대체로 유의한 값을 지니는 것으로 분석되었다.
4.2.1 주택⋅단지⋅입지 특성과 아파트 가격
개별 주택특성 변수 중 전용면적 변수는 두 모형에서 모두 유의한 음의 값을 지니는 것으로 나타났다. 대규모 평수의 주택일수록 가격의 변동이 낮은 점을 고려할 때 이는 선행연구와 일관된 결과로 볼 수 있다. 층수 변수는 두 모형에서 모두 유의한 양의 값을 지니는 것으로 분석되었다. 이는 더 높은 층에 위치한 주택일수록 더 높은 평당 매매가를 지니는 것으로 볼 수 있다.
단지특성 변수 중 건폐율 변수는 두 모형에서 모두 유의한 음의 값을 지니는 것으로 나타났다. 이는 건폐율이 높아질수록 해당 단지 내 평당 매매가가 낮아지는 것으로 해석할 수 있다. 대지면적 변수는 두 모형에서 모두 유의한 양의 값을 지니는 것으로 나타났으나, 두 변수에서 모두 0.0001 미만의 값을 보이며, 낮은 영향정도를 미치는 것으로 분석되었다. 단지 최고층수 변수는 두 변수에서 모두 유의한 양의 값을 지니는 것으로 나타나며, 초고층 아파트를 보유한 단지일수록 높은 평당 매매가를 보이는 것으로 분석되었다. 선행연구에 따르면, 용적률은 해당 단지의 개발밀도를 보여주는 변수로써 부동산 가격 하락에 영향을 줄 수 있는 변수이다(Kim and Kim, 2002). 우면산 인근 부동산의 경우, 유의한 음의 값을 지니며 선행연구와 일관된 결과를 보여주었으나, 한강로 인근 부동산을 종속변수로 한 모형 1에서는 유의하지 않은 것으로 분석되었다. 단지 세대수는 아파트 단지의 규모를 보여주는 변수로써, 대단지 아파트일수록 초등학교, 편의시설, 부대시설 등의 입지가 용이하여 아파트 가격상승에 긍정적인 영향을 줄 수 있는 변수이나(Kim and Ahn, 2010), 두 모형 모두 유의한 음의 값을 보여주고 있다. 이는 한강로 지구의 경우 가장 많은 세대수가 1,458세대, 우면산 지구의 경우 893세대로, 초등학교가 입지할 수 있는 대규모 단지보다는 비교적 중소규모 단지들로 구성되어 있어 규모에 의한 가격 상승효과가 나타나지 않은 것으로 보인다.
입지특성 변수 중 한강까지의 거리 변수는 두 모형에서 모두 유의한 음의 값을 지니며 거리가 멀어질수록 부동산 가격이 감소하는 것으로 나타났다. 이는 기존의 연구결과와 일관된 것으로 볼 수 있다. 초등학교⋅지하철역까지의 거리, 500 m 내 학교⋅지하철역 수 변수는 교육여건 및 역세권을 반영한 변수로써, 거리는 유의한 음의 값을, 각 시설 수는 유의한 양의 값을 지닐 것으로 기대되는 변수이다. 그러나, 한강로 지구 모형에서는 학교 변수들이 유의하나 선행연구와는 반대 결과를 보이고, 우면산 지구 모형에서는 학교수가 반대 결과를 보이는 것으로 나타났다. 즉, 인근에 학교가 많이 위치할수록 낮은 평당 매매가를 보이는 것으로 해석될 수 있다. 이와 관련된 입지특성이 본 연구의 초점은 아니나 향후 학교 및 지하철 등 도시계획시설과 주택가격과의 연구에서 시설의 종류 및 규모 등 개별 특성들에 대한 세부적인 분석이 필요할 것으로 보인다.
4.2.2 침수위험지구가 부동산 가격에 미치는 영향
모형 1은 한강로 침수위험지구 인근 1,500m 내 부동산 평당 실거래가를 종속변수로 하는 모형으로써, 한강로 침수위험지구의 지정 및 정비사업이 인근 아파트 가격에 미치는 시⋅공간적 영향을 분석하였다. 매매년도 더미변수는 2006년을 기준으로 하는 변수로, 각 변수의 회귀계수는 2006년 대비 각 년도 별 부동산 가격의 변화율을 나타낸다. 2007~2017년 변수가 모두 유의한 양의 값으로 나타났으며, 주택 및 입지특성이나 재해위험지구로부터의 거리 더미변수 보다 높은 계수값을 지니고 있어 시간 흐름에 따른 부동산 가격변화가 매우 높음을 알 수 있다. 각 년도별 계수 값은 2009년부터 감소하다가 2011년에 큰 폭(-0.0207 = 0.1648-0.1855)으로 낮아지며, 2011년 이후 2013년도까지 소폭 감소하는 추세를 보이는 것으로 분석되었다. 2011년도에 한강로 침수위험지구가 지정되었음을 고려할 때, 이러한 계수 값의 변화는 침수위험지구의 지정이 부정적인 영향을 미친 것으로 해석할 수 있다. 또한, 2014년에서 2015년 사이 소폭 감소하였다가 이후부터는 각 년도 별 계수 값이 큰 폭으로 지속적인 증가 추세를 보이며 이는 한강로 방재시설 확충사업의 재개 시점과 일치하고 있다. 즉, 재해위험지구 내 정비사업이 지구 인근 아파트 가격 전반에 긍정적인 영향을 미치고 있음을 보여주는 분석결과이다.
재해위험지구로부터의 거리 더미변수는 1,000~1,500 m 구역을 기준으로 하는 변수로, 재해위험지구와의 거리에 따른 부동산 가격의 변화율을 보여주는 변수이다. 거리 더미변수 중 200~400 m, 400~600 m, 800~1,000 m 변수가 각각 유의한 0.1737, -0.0706, 0.0943의 계수 값을 가지는 것으로 나타났다. 400~600 m 구역이 1,000~1,500 m 구역보다 상대적으로 낮은 아파트 가격을 형성하는 것으로 해석 될 수 있으며, 재해위험지구가 아파트 가격에 미치는 영향을 보여주진 못하고 있다. 이는 재해위험지구 지정 이전과 이후(2006-2017)의 모든 부동산거래 자료가 모형에 포함되어 있기 때문에 거리 더미변수만으로는 재해위험지구의 영향을 분리해 낼 수 없기 때문인 것으로 판단된다.
하지만, 거리변수와 매매년도 더미변수를 함께 고려한 상호작용 변수의 분석결과, 200 m 내, 400~600 m, 600~800 m, 800~1,000 m 구간 내 다수의 매매년도 변수가 유의한 값을 지니며 각 구간별 재해위험지구의 다른 영향 정도를 보여주었다. 200 m 내 구간은 대체로 유의한 양의 값으로 나타나 1,000~1,500 m 구역 보다는 가격이 높은 것으로 나타났으나, 2009년에서 2010년 0.0349만큼 증가하다 침수가 발생한 2010년부터 지구가 지정된 2011년 사이에는 0.01만큼 소폭 증가하는 것으로 나타난다. 이후 다시 상승하였다가 빗물펌프장 설치가 난항을 겪은 2014년 큰 폭(-0.2059 = 0.0512-0.2571)으로 감소하는 것으로 나타났다. 방재시설 설치가 재개된 2015년도는 2014년도 계수 값 대비 0.0626만큼의 높은 유의한 양의 값을 보인 것으로 분석되었다. 그 외 구간의 경우는 200~400 m 구간을 제외하고는 유의한 계수값들이 많이 나타나고는 있으나 재해위험지구의 영향이라고 할 수 있는 뚜렷한 패턴은 나타나지 않는 것으로 분석되었다. 400~600 m 구간의 경우, 각 년도별 영향은 2008~2014년까지 유의한 음의 값을 지니는 것으로 나타나지만 시간이 지나면서 그 영향정도가 감소하고 있으며, 600~800 m 구간은 각 년도가 모두 유의한 양의 값을 지니는 것으로 나타나고 있으나, 2013년도를 기점으로 그 영향 정도가 낮은 추세를 보여주고 있다. 800~1,000 m 구간 또한 대체로 각 년도 변수들이 유의한 양의 값을 지니고 있으며, 2012년을 기점으로 부동산 가격이 감소하다가 2015년 다시 증가하는 것으로 나타나지만 일관된 패턴을 보여주지는 않는 것으로 분석되었다.
위의 결과를 종합해 보면, 한강로 침수위험지구의 각 구간별 시간적 영향은 대체로 재해위험지구 지정 시기 및 정비사업 재개시점과 일치하고 있다. 특히, 한강로 침수위험지구의 재해위험지구 지정이 아직 해제되지 않았음을 감안할 때, 침수와 함께 지구지정 자체가 단기적으로는 인접지역 아파트 가격 하락에 영향을 주지만 지속적인 가격 하락을 가져오지는 않으며, 그 이후에는 빗물펌프장 사업과 같은 정비사업의 경과가 아파트 가격에 영향을 주는 것으로 볼 수 있다. 즉, 재해위험지구 지정은 부동산 가격에 부정적인 영향을, 정비사업은 부동산 가격 회복에 긍정적인 영향을 미친 것으로 해석될 수 있다.
4.2.3 붕괴위험지구가 부동산 가격에 미치는 영향
모형 2는 우면산 붕괴위험지구 인근 부동산을 분석 범위로 하는 모형으로써, 우면산 붕괴위험지구의 지정 및 정비사업이 인근 아파트 가격에 미치는 시⋅공간적 영향을 분석하였다. 매매년도 더미변수는 2007~2017년 변수가 모두 유의한 양의 값을 보이며 지속적으로 증가 추세에 있으나, 2011년에서 2013년 사이에는 증가폭이 감소하는 추세를 보이는 것으로 분석되었다. 우면산 붕괴위험지구가 2011년도에 지정되었음을 고려할 때, 이는 우면산 붕괴와 함께 지구지정이 일정부분 아파트가격 상승폭에 부정적 영향을 주었음을 보여준다. 그러나, 다음해까지 복구공사가 진행되면서 붕괴위험지구 지정 직후의 감소추세가 비교적 점진적으로 회복되고 있으며, 2017년의 계수값은 2011년에 비해 1.7배 정도 상승한 것으로 분석되었다.
재해위험지구로부터의 거리 더미변수는 모두 유의하게 나타났으며, 1,000~1,500 m 구간 대비 600~800 m 구간의 아파트가격이 가장 낮고 200 m 이내 구간이 가장 높은 것으로 분석되었다. 이는 한강로 분석 사례와 같이 지구지정 이전과 이후의 부동산 거래자료가 모두 모형에 포함되어 있기 때문이며, 또한 우면산 붕괴위험지구가 우면산 공원과 중복되어, 공원과의 인접성에 따른 부동산 가격상승분이 반영된 결과로 볼 수 있다.
거리변수와 매매 시기를 함께 고려한 상호작용 변수의 분석결과, 200 m 내, 200~400 m, 400~600 m 구간과의 매매년도 상호작용 변수가 대체로 유의하게 분석되었다. 1,000-1,500 m 구간에 비해 600 m 이내의 지역들은 지구 지정 이전부터 상대적으로 부동산 가격이 낮았으나 지정 이후 특히 400 m 이내 지역에서 부정적 영향이 높게 나타나고 어느 정도 지속되고 있는 것으로 나타났다. 400 m 밖의 구간에서는 지구지정 년도인 2011년도 변수가 유의하지 않게 나타나고 있으며 지구 지정에 따른 뚜렷한 영향 패턴은 보이지는 않는 것으로 분석되었다.
구간별로 살펴보면, 200 m 내 구간은 2009~2017년도 변수가 유의한 음의 값을 지니는 것으로 분석되었다. 우면산 붕괴가 일어나고 붕괴위험지구가 지정된 2011년과 그 다음해 2012년까지 큰 폭으로 아파트 가격에 부정적 영향을 주고(계수값의 감소폭(-0.0635 = (-0.2552)-(-0.1917))이 가장 크게 나타남), 우면산 복구사업 이후인 2013년도에는 0.0419 (=(-0.2133)-(-0.2552) 만큼 상승하여 일시적으로 부정적 영향정도가 감소한 것으로 분석되었으나 지구지정 이전에 비해서는 여전히 부정적 영향이 높은 것으로 나타났다. 200~400 m 구간에서는 지구지정이 일어난 2011년까지 부정적 영향이 높게 증가하고, 그 이후로는 부정적이기는 하나 복구사업과 함께 그 영향 정도가 약해지며 2015년을 제외하면 대체로 지구지정 이전과 비슷한 추세를 보이는 것으로 나타난다. 또한 계수값에서도 200 m 이내 지역보다 크기가 작게 나타나 붕괴위험지구로부터 거리가 멀어짐에 따라 부정적 영향도 감소하는 것으로 분석되었다.
모형2의 분석결과를 종합하면, 우면산 붕괴위험지구의 경우는, 우면산 붕괴와 함께 지구 지정이 주변 아파트 가격에 부정적 영향을 주고, 그 이후로는 점차 회복되는 것으로 나타났다. 단, 시공간적 영향에서는 지구지정이 인근 400 m 내 지역의 아파트 가격에 부정적 영향을 주고 지구 내 복원사업이 지구 지정에 의한 감소추세를 어느 정도 완화시킬 수 있는 것으로 분석되었다.
5. 결 론
기후변화 현상과 함께 증가하고 있는 자연재해는 국내외에서 주요한 도시문제로서 이슈화 되고 있다. 국내에서는 이를 예방하기 위한 도시계획적 기법으로써, 자연재해발생 우려지역을 대상으로 재해위험지구를 지정하고 정비사업을 시행하도록 하고 있다. 하지만, 지구지정으로 인해 나타날 수 있는 부동산 가격하락 등을 우려하는 거주민들의 민원 등으로 인하여 재해위험지구의 지정 및 정비사업은 부진한 실정이다.
자연재해의 발생 및 지구 지정으로 인한 재해지역으로의 인식이 부동산 가격 하락에 미치는 영향은 과거 다수의 연구들에서 다루어져 왔다. 이러한 견해와는 반대로, 재해위험지구 지정에 의한 정비사업의 긍정적인 결과 및 오히려 지가가 상승할 수 있다는 연구들 또한 존재하고 있다. 이와같이 재해위험지구의 부동산 가격에 미치는 영향에 대한 상반되는 주장에도 불구하고 이와 관련된 실증적 연구는 미흡한 실정이다. 이에 본 연구는 재해위험지구의 지정 및 정비사업이 지구 및 인근지역 아파트가격에 미치는 영향을 분석 하였다.
이를 위하여 본 연구에서는 높은 인구 밀도와 함께 가장 높은 부동산 가격이 형성되어 있는 서울특별시를 대상으로, 용산구의 한강로 침수위험지구, 서초구 우면산 붕괴위험지구를 사례지역으로 선정하여, 재해위험지구가 인근지역 아파트가격에 미치는 영향을 분석하였다. 분석은 헤도닉 가격모형에 기반한 모형을 구축하여 실시하였으며, 2006~2017년 아파트 실거래가를 종속변수로, 선행연구검토를 통해 도출한 부동산 가격 영향변수와 함께 매매년도 및 재해위험지구와의 거리변수, 두 변수의 상호작용 변수를 독립변수에 포함하여 재해위험지구의 지정 및 정비사업에 따른 시⋅공간적 영향정도를 분석하였다.
분석결과, 한강로 침수위험지역에서는 지구 지정 이후 정비사업 전까지의 기간이 주변 아파트 가격에 부정적 영향을 미친 것으로 나타났다. 정비사업 이후에는 아파트 가격이 회복되는 추세의 결과가 나타나며, 지구 지정 이후의 정비사업이 아파트 가격 상승에 긍정적인 영향을 주는 것으로 분석되었다. 즉, 침수위험지구의 지정은 단기적으로 아파트 가격에 부정적 영향을 주지만 그 이후에는 정비사업의 결과에 따라 아파트 가격이 회복되거나 높아 질 수 있음을 의미한다. 이는 지구지정 자체보다 재해에 대한 위험인식이 부동산 가격에 더욱 부정적 영향을 줄 수 있음을 시사한다. 우면산 붕괴위험지구를 대상으로 한 모형에서는 인근 400 m 내 구간에서 붕괴위험지구 지정으로 인한 전반적인 아파트 가격 하락영향이 존재하고 있는 것으로 나타났다. 일시적이기는 하나 정비사업 직후에는 그 영향정도가 약화되며 정비사업이 아파트 가격 회복에 영향을 미친 것으로 분석되었다.
이와 함께, 정비사업 이후에도 지속적인 음의 추세가 이어지고 있는 몇몇 구간들이 존재하는 것으로 분석되었다. 이러한 현상의 원인으로는 크게 세 가지 가능성이 존재한다. 첫째, 재해위험지구의 지정이 부동산 가격에 부정적임을 고려할 때, 정비사업이 이루어졌음에도 불구하고 해제되지 않고 있는 재해위험지구의 영향이 일부 구간에서는 정비사업의 양(+)적 영향보다 더 크게 작용할 수 있다는 것이다. 둘째, 현재 재해위험지구의 지정이 민원 등으로 인하여, 실질적 자연재해 피해 우려지역을 포함 하지 못하고 도로, 산, 하천 등을 중심으로 지정되어 있어, 정비사업 또한 협소하게 이뤄지며 이에 대한 공간적 영향이 지구 지정으로 인한 부정적 영향 범위를 포함하지 못한다는 것이다. 셋째, 지구 지정 자체보다는 자연재해 유형에 따른 재해 위험 인식도가 부동산 가격에 더 큰 영향을 줄 수 있다. 용산 한강로 침수위험지구의 경우 빗물펌프장의 지하화 및 공원화를 통해 재해 위험 노출에 대한 인식도를 상당히 낮출 수 있었으나, 우면산 붕괴위험지구의 경우는 재해 규모로 인한 심리적 충격이 매우 컸으며 복원사업을 둘러싼 언론 등에서의 보도들이 여전히 많은 사람들로 하여금 우면산 지역을 위험지역으로 인식하게 하고 있다.
이러한 분석결과를 종합할 때, 본 연구의 시사점은 다음과 같이 요약될 수 있다. 첫째, 재해위험지구의 지정은 부동산 가격에 부정적인 영향을 미칠 수 있으나, 그 자체보다도 지구 내 정비사업의 경과가 부동산 가격회복에 큰 영향을 줄 수 있다. 따라서, 기능 및 시각적으로 재해위험을 제거할 수 있는 정비사업 계획안을 통해 주민들의 우려를 완화시키고 자연재해 발생 가능지역에 대한 재해위험지구의 지정을 신속히 추진할 필요가 있다. 둘째, 재해위험지구는 침수, 유실, 고립, 취약방재, 붕괴, 해일 등 재해위험 유형과 도시지역 및 비도시지역 등 지역 유형에 따라서도 부동산 가격에 대한 파급효과가 매우 상이할 것이다. 서울시에서는 지금까지 침수위험지구와 붕괴위험지구만 지정되어 왔으나 향후 연구에서는 기타 유형들에 대한 다각적 분석을 통해 재해위험지구의 부동산 가격에 대한 영향을 측정할 필요가 있다. 또한 지방도시 내 부동산들은 서울시와는 다른 특성을 지니고 있으며, 다양한 유형의 재해위험지구가 지정되어 왔다. 향후에는 지방도시를 대상으로 다양한 재해위험지구의 영향을 분석하여 재해위험지구의 대한 논의가 전국차원에서 이뤄질 필요가 있다.