화산재 퇴적에 의한 농작물의 생산량 손실 예측

Loss Prediction of Agricultural Crops Induced by Volcanic Ash Deposition

Article information

J. Korean Soc. Hazard Mitig. 2017;17(2):525-532
Publication date (electronic) : 2017 April 30
doi : https://doi.org/10.9798/KOSHAM.2017.17.2.525
함희정*, 최승훈, 윤우석***, 이승수****
* Member, Professor, School of Urban and Architecture, Kangwon National University
*** Ph.D Candidate, Department of Architectural Engineering, Kangwon National University
**** Member, Professor, School of Civil Engineering, Chungbuk National University
**Corresponding Author, Member, Ph.D Student, Department of Architectural Engineering, Kangwon National University (Tel: +82-33-250-7280, Fax: +82-33-259-5542, E-mail: krcsh@daum.net)
Received 2016 October 26; Revised 2016 October 31; Accepted 2016 November 21.

Abstract

본 연구에서는 화산재 퇴적에 의한 농작물의 생산량 손실을 예측하였다. 이를 예측하기 위하여 2006년 인도네시아 머라피(Merapi) 화산분화 시 농작물에서 관측된 피해영향 자료를 기초로 화산재 취약도를 개발하고, 2015년 농작물 생산통계를 기반으로 농작물의 연간 생산량을 파악하였다. 또한, 농작물의 계절별 취약성을 고려하기 위하여 네 가지의 계절적 영향계수(0.00, 0.25, 0.75, 1.00)를 정의하였다. 본 논문에서는 예측된 농작물의 생산량 손실 중 강원도 지역 농작물을 예시로 제시하였다. 본 연구로부터 화산재 퇴적두께가 증가함에 따라 강원도에서 재배되는 농작물에 대하여 최대 90% 이상의 손실률이 발생되는 것을 확인할 수 있었다. 본 연구에서 개발된 농작물의 생산량 손실 예측 알고리즘은 백두산과 한반도 주변국 화산분화 시 발생할 수 있는 잠재적 위험도 또는 손실을 평가하기 위하여 활용될 예정이다.

Trans Abstract

This paper presents a prediction of production loss for agricultural crops induced by volcanic ash deposition. Production losses of agricultural crops were predicted by using the volcanic ash fragility, annual yield, and seasonality coefficient of agricultural crops. The volcanic ash fragility of agricultural crops was developed by using observed damage data from the 2006 eruption of Merapi volcano in Indonesia. Annual yields of agricultural crops were obtained from the 2015 statistics for production of agricultural crops in South Korea. Seasonality coefficient of agricultural crops was defined by 4 types (0.00, 0.25, 0.75, and 1.00) with considering cultivation time for each object crop. This paper only shows the prediction of production loss for 24 agricultural crops in Gangwon province as an example. From the prediction, it is found that production loss ratio of agricultural crops can be reached more than 90 % as volcanic ash deposition increases. The algorithm of production loss on agricultural crops established in this study can be applied to evaluate potential losses or risks from volcanic eruptions around the Korean Peninsula.

1. 서론

1980년 미국 워싱턴 주 스카마니아(Skamania)의 세인트 헬렌즈(Saint Helens) 화산분화는 용암류, 화산이류, 화쇄류, 화산재 등으로 막대한 피해를 발생시킨 화산 중 하나이다(Nimlos and Hans, 1982). 특히, 화산재는 대기 기상장으로 인하여 수백 km 떨어진 농경지에 1억 9천 달러(1980년 환율기준 1,153억 원)의 피해액을 발생시켰다(Lee et al., 2013). 이 세인트 헬렌즈 화산보다 서기 946년~947년에 강력한 화산폭발을 한 것으로 기록된 백두산에서 최근 화산성 지진이 10배 이상 급증하고, 고온의 화산가스 방출량이 증가하는 등 화산분화 가능성이 높아지고 있다(Park et al., 2014). 만약 우리나라와 근접해 있는 백두산이 분화하게 되면 국내에서는 화산재 등으로 인한 경제적, 인적 피해가 발생할 가능성이 높기 때문에 이에 대하여 사전에 예측할 필요가 있다(Ham et al., 2016).

뉴질랜드에서는 화산분화 피해를 사전에 예측하기 위하여 RiskScape(Wilson and Kaye, 2007a)로 명명된 위험도 평가 소프트웨어를 개발하여 사용하고 있다. 국내에서도 화산분화 피해를 사전에 예측할 수 있는 위험도 평가기법 연구가 요구되지만, 현재 관련 분야에 대한 연구가 미흡한 상태이다(Ham et al., 2014a). 이에 본 연구에서는 국내에 부재한 화산재 퇴적피해를 예측할 수 있는 취약도 평가 기법을 개발하고, 강원도 지역을 예시로 지역적 농작물의 생산량 손실을 예측하고자 한다.

2. 농작물의 생산량 손실 예측 방법론

화산재 퇴적으로 인한 농작물의 생산량 손실은 Eq. (1)과 같이 농작물의 화산재 취약도, 연간 생산량, 계절적 영향계수(Seasonality Coefficients)를 통하여 산정될 수 있다(Choi et al., 2016).

(1)L(x)=Fτ(x)PS

여기서, L(x)는 임의의 화산재 퇴적두께에 따른 농작물의 생산량 손실, Fr(x)는 농작물의 화산재 취약도, P는 농작물의 연간 생산량, S는 농작물의 경작시기를 고려한 계절적 영향계수를 각각 의미한다.

2.1 화산재 취약도 구축 방법론

농작물의 화산재 취약도는 임의의 화산재 퇴적으로 인하여 해당 작물의 손상이나 수확불능 등과 같은 피해를 유발시킬 수 있는 확률에 대한 함수이다. 이러한 취약도 함수는 Schultz(2010) 연구에 의해 Table 1과 같이 네 종류의 접근법으로 분류되며, 본 연구에서는 전문가적 접근법과 경험적 접근법을 조합한 혼합적 접근법을 이용하여 화산재 취약도를 구축하였다.

Fragility Modeling Approaches

2.1.1 화산재 취약도 평가 작물 선정

백두산 및 한반도 주변국 화산분화 시 발생되는 화산재는 지역마다 상이한 두께로 퇴적되어 지역적 화산재 위험도 분석이 선행될 필요가 있다고 판단된다. 선행된 백두산 화산재 확산 연구에 따르면 한반도에서 화산재 퇴적이 가장 높을 수 있는 곳 중의 하나로 강원도 지역을 선정하고 있다(Donga Studio, 2015). 본 연구에서는 강원도 지역을 중심으로 화산재 퇴적에 따른 농작물 손실을 평가하였다. 강원도 지역의 현재 농작물 생산량을 파악하기 위하여 이전년도(2015년)의 농업통계량(Statistic Korea, 2015)을 적용하여 Table 2와 같이 식량작물 14종과 채소 10종으로 선정하였다.

Types of Agricultural Crops in Gangwon Province

2.1.2 농작물에 대한 화산재 영향성 분석

Table 1의 혼합적 접근법을 이용한 화산재 취약도를 구축하기 위해서는 해당 분야의 전문가적 견해로부터 평가된 화산재 영향성(전문가적 접근법)과 실제 관측된 과거 화산재 피해자료(경험적 접근법)가 필수적으로 요구된다. 이에 본 연구에서는 Table 3과 같이 2006년 인도네시아 머라피(Merapi) 화산분화 시 뉴질랜드 GNS Science에서 평가한 농작물의 화산재 영향성과 실제 농작물에서 관측된 화산재 피해영향 자료를 조합하여 1%~90%까지 피해율을 유발시킬 수 있는 화산재 퇴적두께를 분석하였다(Wilson and Kaye, 2007a).

Volcanic Ash Damage Rates and Effects on Agricultural Crops

2.1.3 화산재 취약도 데이터베이스 구축 방안

화산재 퇴적으로 인한 농작물의 영향성은 Table 3과 같이 이산함수의 형태이다. 화산재 취약도는 연속적인 화산재 퇴적 두께로 인한 피해확률을 평가하기 때문에 본 연구에서 분석된 농작물의 화산재 영향성을 연속함수의 형태로 표현할 필요가 있다. 취약도에 관한 선행연구(Ham et al., 2014b; Wilson and Kaye, 2007a)에서는 대수정규(Log-normal), 와이블(Weibull) 등과 같은 누적분포함수를 이용하여 연속함수의 형태로 취약도를 표현하였다. 하지만 이들 두 취약도는 2개의 모수를 갖는 누적분포함수로서 본 연구에서 분석된 농작물의 화산재 영향성을 적절하게 모사하지 못하였다(Choi et al., 2016).

이에 본 연구에서는 Eq. (2)와 같이 3개의 모수를 갖는 GEV(Generalized Extreme Value) 누적분포함수를 이용하여 이산함수 형태의 화산재 영향성을 곡선맞춤(Curve Fitting)하였다(Kottegoda and Rosso, 1997). GEV 누적분포함수의 모수 추정 방법으로는 Eq. (3)의 최소자승법(Least Square Method)이 이용되었다(Baker, 2015).

(2)Fτ(x)=exp{(1ξ(xμ)σ)1/ξ}
(3)ξ^,σ^,μ^=minυ=1m[Pd(x)Fτ(x)]2

여기서, x는 임의의 화산재 퇴적두께(mm), ξ, σ, μ는 GEV 누적분포함수의 모수, Pd(x)는 2006년 인도네시아 머라피 화산분화 시 농작물에서 관측된 화산재 영향성, Fr(x)는 최소자승법으로 데이터베이스화된 농작물에 대한 화산재 취약도를 각각 의미한다.

2.2 농작물에 대한 연간 생산량

본 연구에서 평가 작물로 선정된 24종의 농작물은 농림축산식품부에서 제시한 2015년 농작물 생산통계(Statistics Korea, 2015)를 통하여 Table 4와 같이 연간 생산량을 파악하였다. Table 4와 같이 강원도 지역 농작물의 총 생산량은 861,599톤으로 논벼(21%), 감자(21%), 배추(30%), 무(12%)가 전체 농작물 중 약 84%를 차지함에 따라 강원도 지역의 대표 작물임을 알 수 있다.

Annual Yields of Agricultural Crops in Gangwon Province

2.3 계절적 영향계수 설정

Eq. (1)의 계절적 영향계수는 동일한 화산재가 퇴적되었을 경우라도 경작시기에 따라 받게 되는 화산재 영향성이 상이한 점을 농작물의 손실 예측 시 반영하기 위한 계수이다. 농한기나 파종기에는 ‘0.00’ 또는 ‘0.25’, 성장기나 수확기에는 ‘0.75’ 또는 ‘1.00’의 계수를 통하여 화산재 영향성을 보정할 수 있다(Wilson and Kaye, 2007a). 본 논문에서는 화산재 퇴적으로 인한 보수적인 영향성을 검토하기 위해 가장 취약한 시기인 수확기로 고려하여 ‘1.00’의 계절적 영향계수가 적용된 연구결과만 제시하였다.

3. 농작물의 생산량 손실 예측 결과

본 장에서는 2006년 인도네시아 머라피 화산분화 시 분석된 농작물의 화산재 피해영향 자료를 기반으로 구축된 화산재 취약도와 Eq. (1)을 통하여 산정된 강원도 지역 농작물의 생산량 손실 예측 결과를 보인다.

3.1 화산재 취약도 구축 결과

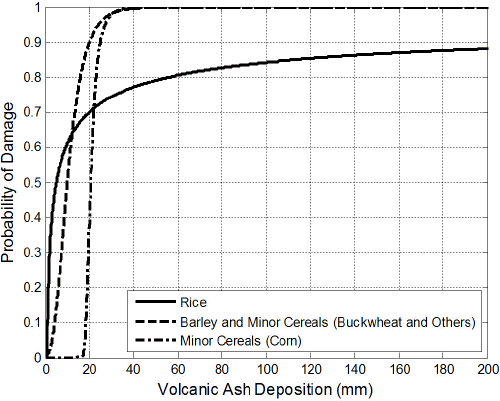
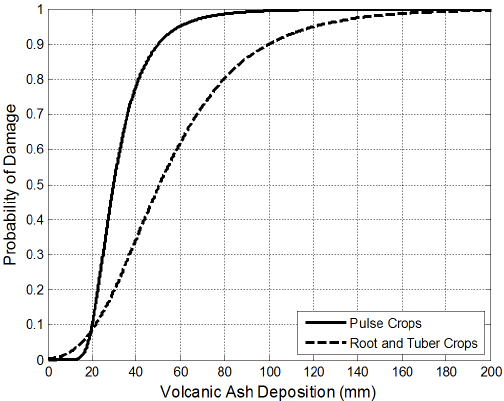
Figs. 1~3Table 5는 임의의 화산재 퇴적두께에 대하여 식량작물(미곡, 맥류, 잡곡, 두류, 서류)과 채소(과채류, 엽채류, 근채류)의 취약도 곡선 및 GEV 누적분포함수의 모수를 보인다.

Fig. 1

Volcanic Ash Fragilities of Rice, Barley, and Minor Cereals

Fig. 3

Volcanic Ash Fragilities of Fruit, Leaf, and Root Vegetables

Parameters of GEV Cumulative Distribution Function for Agricultural Crops

Fig. 1과 같이 40mm의 화산재가 퇴적될 경우 미곡(Rice), 맥류(Barley), 잡곡(Minor Cereals; 호밀, 기타), 옥수수의 피해확률은 각각 77%, 100%, 100%로서 농작물 종류에 따라 상이한 피해확률을 보이는 것을 알 수 있다. 하지만 20mm의 화산재 퇴적 시에 미곡은 70%, 맥류와 잡곡(호밀, 기타)는 90%의 피해확률을 나타내는 반면, 옥수수는 40%의 피해확률을 보이는 것을 알 수 있다. 이와 같이 적은 화산재 퇴적두께에서 피해확률이 달라지는 이유는 옥수수 알의 겉껍질이 미곡, 맥류, 잡곡(호밀, 기타)에 비해 화산재 퇴적으로부터의 보호를 받기 때문인 것으로 판단된다.

Fig. 2는 두류(Pulse Crops)와 서류(Root And Tuber Crops)에 대한 화산재 취약도 결과이다. 화산재 퇴적두께 20mm 미만에서 서류가 두류에 비해 취약한 반면, 화산재 퇴적두께 20mm 이상에서는 두류가 서류보다 취약한 것을 알 수 있다. 20mm 미만의 화산재 퇴적에서 두류는 서류보다 안전할 수 있으나, 20mm 이상의 화산재 퇴적에서는 Wilson(2007a)의 연구와 같이 서류가 지면 속에서 성장하는 농작물의 특성상 화산재 퇴적에 대한 높은 저항력을 갖게 되어 그 피해가 낮은 것을 알 수 있다.

Fig. 2

Volcanic Ash Fragilities of Pulse, Root and Tuber Crops

Fig. 3과 같이 근채류(Root Vegetables)의 화산재 취약도는 과채류(Fruit Vegetables), 엽채류(Leaf Vegetables)와 비교하였을 때 그 형태가 상이한 것을 알 수 있다. 과채류와 엽채류의 화산재 취약도는 0mm~20mm 사이에서 급격한 피해확률을 보이는 반면, 근채류의 화산재 취약도는 0mm~100mm 이상까지 비교적 완만한 피해확률을 보인다. 이는 Wilson(2007a)의 연구와 같이 대기에 직접적으로 노출되어 성장되는 엽채류와 과채류에 비해 근채류는 지면 속에서 성장하는 특성으로 인하여 화산재 퇴적에 대해 저항력이 높기 때문이다.

엽채류의 배추, 양배추, 시금치, 상추는 화산재가 3mm 퇴적될 경우 약 40%의 동일한 피해확률을 보이지만, 20mm가 퇴적될 경우 배추(Chinese Cabbage)와 양배추(Cabbage)는 79%, 시금치(Spinach)와 상추(Lettuce)는 97%의 피해확률을 보이는 것을 알 수 있다. 동일한 엽채류지만 배추와 양배추의 겉잎이 성장함에 따라 화산재로부터 보호받기 때문에 시금치와 상추에 비해 화산재 퇴적에 대해 피해가 적은 것을 알 수 있다.

3.2 농작물의 생산량 손실 예측 결과

Table 6은 Eq. (1)을 통하여 산정된 강원도 지역 24종 농작물을 대상으로 화산재 퇴적두께에 따른 연간 생산량 손실을 예측한 결과이다. 이 결과로부터 화산재 퇴적두께, 화산재 취약도, 농작물의 연간 생산량에 따라 상이한 생산량 손실이 예측되는 것을 알 수 있다. 강원도 지역에서 재배되는 농작물 중 약 84%를 차지하는 무, 감자, 논벼, 배추는 화산재 퇴적두께가 10mm일 경우 각각 2,317톤, 3,948톤, 107,921톤, 177,694톤의 생산량 손실이 예측되었다. 이것은 해당 화산재 취약도(근채류, 서류, 미곡, 배추)로 인하여 화산재 퇴적두께 10mm일 경우 Figs. 23과 같이 상이한 피해확률(2%, 2%, 61%, 67%)을 보이기 때문이다.

Predicted Production Losses of Agricultural Crops in Gangwon Province (ton)

Fig. 4는 10mm~100mm의 화산재 퇴적두께에 따른 강원도 지역의 전체 생산량 피해율을 보이고 있다. Fig 4와 같이 100mm의 화산재 퇴적은 10mm의 화산재 퇴적보다 약 2.15배, 50mm의 화산재 퇴적보다 약 1.22배의 높은 피해율이 발생되는 것을 알 수 있다. 이러한 결과는 소량의 화산재 퇴적(20mm 이하)에서 높은 피해확률을 보인 미곡, 맥류, 잡곡, 두류, 과채류, 엽채류에 대한 화산재 취약도에 기인한다.

Fig. 4

Damage Ratio of Agricultural Crops in Gangwon Province Induced by Volcanic Ash Depositions

4. 결론

본 연구에서는 화산재 퇴적으로 인한 농작물의 생산량 손실을 예측하였다. 평가 지역은 강원도로 한정하였으며, 10종의 화산재 취약도와 24종의 연간 생산량, 네 가지의 계절적 영향계수(0.00, 0.25 0.75 1.00)를 분석하고 구축하였다.

농작물에 대한 화산재 취약도는 혼합적 접근법을 적용하여 구축되었으며, 이는 GEV 누적분포함수의 모수 형태로 데이터베이스화되었다. 또한, 통계청 자료를 통하여 농작물의 연간 생산량을 파악하였으며, 각각의 작물에 대한 경작시기를 고려하여 계절적 영향계수를 정량화하였다.

화산재 퇴적으로 인한 강원도 지역의 농작물은 각각의 화산재 퇴적두께에 따라 상이한 생산량 손실이 예측되었다. 가장 취약한 시기인 수확기에 생산량 손실은 화산재 퇴적두께 10mm에서는 42%, 50mm에서는 74%, 100mm에서는 90%로 구축된 농작물의 화산재 취약도과 연간 생산량에 따라 상이한 것을 확인하였다.

본 연구에서 예측된 농작물의 생산량 손실 추정결과는 백두산과 한반도 주변국 화산분화 시에도 활용될 수 있다고 판단된다. 또한, 실제 화산재 등을 이용한 실험을 통하여 본 연구에서 예측한 농작물의 생산량 손실을 검증할 필요가 있다고 사료된다.

감사의 글

본 연구는 정부(국민안전처)의 재원으로 재난안전기술개발사업단의 지원을 받아 수행된 연구임 [MPSS-자연-2015-81].

References

Baker J.W. 2015;Efficient Analytical Fragility Function Fitting Using Dynamic Structural Analytical. Earthquake Spectra 31(1):579–599. 10.1193/021113EQS025M.
Choi S.H, Ham H.J, Yun W, Lee S. 2016;Loss Assessment of Agricultural Crops Subjected to Volcanic Ash Fall Hazards. Journal of The Wind Engineering Institute of Korea 19(4):39–47.
Donga Studio. 2015. Ash Deposition Can be Reached up to 10 cm by Baekdu Mountain Volcano Eruption http://studio.donga.com/View?idxno=201505210027&c=00030003.
Ellingwood B.R, Rosowsky D.V, Li Y, Kim J.H. 2004;Fragility Assessment of Light-Frame Wood Construction Subjected to Wind and Earthquake Hazards. Journal of Structural Engineering 130(12):1921–1930. 10.1061/(ASCE)0733-9445(2004)130:12(1921).
Hall J, Dawson R, Sayers P, Rosu C, Chatterton J, Deakin R. 2003;A Methodology for National-Scale Flood Risk Assessment. In. Proceedings of the Institution of Civil Engineers, Water and Maritime Engineering 156(3):235–247. 10.1680/wame.2003.156.3.235.
Ham H.J, Choi S.H, Lee S, Kim H.J. 2014a;Fragility Assessment of Agricultural Facilities Subjected to Volcanic Ash Fall Hazards. J. Comput. Struct. Eng. Inst. Korea 27(6):493–500. 10.7734/COSEIK.2014.27.6.493.
Ham H.J, Choi S.H, Yun W, Lee S. 2016;Fragility Development of Horticultural & Herbal Facilities Subjected to Volcanic Ash Fall Hazards. J. Volcanic Hazard Mitigation Korea 1(1):11–16.
Ham H.J, Yun W, Kim H.J, Lee S. 2014b;Evaluation of Extreme Wind Fragility for Balcony Windows Installed in Mid/Low-Rise Apartments. J. Korean Soc. Hazard Mitig 14(1):19–26. 10.9798/KOSHAM.2014.14.1.19.
Kottegoda N.T, Rosso R. 1997. Statistics, Probability, and Reliability for Civil and Environmental Engineers McGraw-Hill. New York:
Lee Y.J, Kim S.D, Chun J.S, Woo G. 2013;Estimation of Economic Losses on the Agricultural Sector in Gangwon Province, Korea, Based on the Baekdusan Volcanic Ash Damage Scenario. Jour. Korean Earth Science Society 34(6):515–523. 10.5467/JKESS.2013.34.6.515.
Nimlos T.J, Hans Z. 1982;The Distribution and Thickness of Volcanic Ash in Montana. Northwest Science 56(3):190–198.
Park K.O, Yoon S.H, Kim G.Y. 2014;A Study on Risk Factors and Response of the Air Traffic Section by the Volcanic Eruption. J. Korean Soc. Hazard Mitig 14(6):159–167. 10.9798/KOSHAM.2014.14.6.159.
Rossetto T, Elnashai A. 2003;Derivation of Vulnerability Functions for European-Type RC Structures Based on Operational Data. Engineering Structures 25:1241–1263. 10.1016/S0141-0296(03)00060-9.
Schultz M.T, Gouldby B.P, Simm J.D, Wibowo J.L. 2010;Beyond the Factor of Safety: Developing Fragility Curves to Characterize System Reliability. US Army Corps of Engineers
Singhal A, Kiremidjian A.S. 1998;Bayesian Updating of Fragilities with Application to RC Frames. Journal of Structural Engineering 124(8):922–929. 10.1061/(ASCE)0733-9445(1998)124:8(922).
Statistics Korea. 2015. Agricultural Statistics of Production Korean Statistical Information Service.
Wilson T.M, Kaye G.D. 2007a;Agricultural fragility estimates for volcanic ash fall hazards. GNS Science Report, 2007/37
Wilson T.M, Kaye G.D, Stewart C, Cole J. 2007b;Impacts of the 2006 eruption of Merapi volcano, Indonesia, on agriculture and infrastructure. GNS Science Report, 2007/07

Article information Continued

Table 1

Fragility Modeling Approaches

Approach Definition
Judgmental Judgmental fragility that is based on some form of expert opinion is classified as judgmental (Hall et al., 2003).
Empirical Empirical fragility is based on observational data documenting damage of agricultural commodities under a variety of loads (Rossetto et al., 2003).
Analytical Analytical fragility is based on statistical models that characterize the performance limit state of agricultural commodities (Ellingwood et al., 2004).
Hybrid A hybrid approach for developing fragility uses a combination of two or more approaches described above in an attempt to overcome their various limitations (Singhal et al., 1998).

Table 2

Types of Agricultural Crops in Gangwon Province

Classification Type
Food Crops Rice Aquatic Rice, Upland Rice
Barley Hulled Barley, Naked Barley, Wheat
Minor Cereals Corn, Buckwheat, Others
Pulse Crops Soya, Adzuki Bean, Mung Bean, Others
Root And Tuber Crops Sweet Potato, Potato
Vegetables Fruit Vegetables Watermelon, Oriental Melon, Cucumber, Squash
Leaf Vegetables Chinese Cabbage, Spinach, Lettuce, Cabbage
Root Vegetables Daikon, Carrot

Table 3

Volcanic Ash Damage Rates and Effects on Agricultural Crops

Classification Damage Rate (%) Ash Depth (mm) Effects (Damage)
Rice 50 5 Fifty percent of rice is likely to be unsaleable.
70 20 Seventy percent of rice is likely to be unsaleable.
Barley 1 1 Some abrasion and chemical damage.
50 10 Fifty percent of barley cannot be harvested.
90 20 Ninety percent of barley cannot be harvested.
Minor Cereals Corn 40 20 Forty percent of corn cannot be harvested.
90 25 Mature corn (2.5m high) abandoned despite kernels appearing unaffected.
Buckwheat, Others 1 1 Some abrasion and chemical damage.
50 10 Fifty percent of minor cereals is not able to harvest.
90 20 Ninety percent of minor cereals is not able to harvest.
Pulse Crops 10 20 Ten percent of pulse crops is likely to be unsaleable.
30 25 Thirty percent of pulse crops is likely to be unsaleable.
90 50 Ninety percent of pulse crops is likely to be unsaleable.
Root And Tuber Crops 1 5 Some abrasion and chemical damage on leaves.
20 30 Increased impacts to leaves ground leaves.
90 100 Crop lost due to higher amounts of ash accumulating and overwhelming leaf stalks near the ground.
Fruit Vegetables 1 1 Some abrasion and chemical damage.
20 3 Some crops are destroyed from abrasion of fruit by ash and absorption of ash similar into skins, similar to tree crops but more severe as closer proximity to the ground.
90 10 Very small amount of crop can be successfully harvested and sold after intense washing and ash removal efforts during cleanup.
Leaf Vegetables Chinese Cabbage, Cabbage 30 2.5 Thirty percent of chinese cabbage and cabbage is likely to be unsaleable.
80 22.5 Eighty percent of chinese cabbage and cabbage is likely to be unsaleable.
Spinach, Lettuce 1 1 Some abrasion and chemical impacts.
20 2 Increased difficulty removing volcanic ash from crops to a satisfactory level for sale.
90 10 Ninety percent of spinach and lettuce is likely to be unsaleable.
Root Vegetables 1 5 Some abrasion and chemical damage to leaves.
20 30 Increased impacts to leaves near the ground.
90 100 Crops are lost due to higher amounts of ash accumulating and overwhelming leafy vegetable stalks near the ground.

Table 4

Annual Yields of Agricultural Crops in Gangwon Province

Classification Type Yield (ton)
Rice Aquatic Rice 176,674
Upland Rice 2
Barley Hulled Barley 244
Naked Barley 51
Wheat 15
Miscellaneous Grain Crop Corn 29,176
Buckwheat 339
Others 2,523
Pulse Crops Soya 9,952
Adzuki Bean 126
Mung Bean 57
Others 607
Root And Tuber Crops Sweet Potato 7,638
Potato 177,023
Fruit Vegetables Watermelon 25
Oriental Melon 21
Cucumber 10,840
Squash 28,025
Leaf Vegetables Chinese Cabbage 262,248
Spinach 338
Lettuce 3,704
Cabbage 45,257
Root Vegetables Daikon 103,923
Carrot 2,791
Total Amount 861,599

Fig. 1

Volcanic Ash Fragilities of Rice, Barley, and Minor Cereals

Fig. 2

Volcanic Ash Fragilities of Pulse, Root and Tuber Crops

Fig. 3

Volcanic Ash Fragilities of Fruit, Leaf, and Root Vegetables

Table 5

Parameters of GEV Cumulative Distribution Function for Agricultural Crops

Classification ξ σ μ
Rice 2.253 4.268 2.569
Barley 0.066 4.870 8.193
Minor Cereals Corn 0.161 1.907 19.832
Buckwheat, Others 0.066 4.870 8.193
Pulse Crops 0.180 8.450 26.543
Root And Tuber Crops 0.055 24.442 41.479
Fruit Vegetables 0.156 2.220 4.018
Leaf Vegetables Chinese Cabbage, Cabbage 1.558 3.245 3.023
Spinach, Lettuce 0.554 1.634 2.684
Root Vegetables 0.055 24.442 41.479

Table 6

Predicted Production Losses of Agricultural Crops in Gangwon Province (ton)

Classification Volcanic Ash Deposition (mm)
10 20 30 40 50
Rice Aquatic Rice 107,921.08 123,668.85 131,352.23 136,193.79 139,627.10
Upland Rice 1.22 1.40 1.49 1.54 1.58
Barley Hulled Barley 122.01 219.57 239.22 242.93 243.73
Naked Barley 25.50 45.89 50.00 50.78 50.94
Wheat 7.50 13.50 14.71 14.93 14.98
Minor Cereals Corn 0.00 11,671.00 28,561.28 29,115.38 29,164.79
Buckwheat 169.51 305.05 332.36 337.52 338.62
Others 1,261.56 2,270.36 2,473.59 2,511.97 2,520.20
Pulse Crops Soya 0.14 995.54 5,072.96 7,777.56 8,957.76
Adzuki Bean 0.00 12.60 64.23 98.47 113.41
Mung Bean 0.00 5.70 29.06 44.55 51.31
Others 0.01 60.72 309.41 474.37 546.36
Root And Tuber Crops Sweet Potato 170.35 651.65 1,527.77 2,639.66 3,762.72
Potato 3,948.20 15,103.14 35,408.62 61,178.36 87,207.18
Fruit Vegetables Watermelon 22.50 24.80 24.97 24.99 25.00
Oriental Melon 18.90 20.83 20.97 20.99 21.00
Cucumber 9,755.02 10,753.43 10,826.11 10,836.65 10,838.95
Squash 25,219.96 27,801.18 27,989.08 28,016.34 28,022.30
Leaf Vegetables Chinese Cabbage 177,694.88 205,986.49 218,127.89 225,186.66 229,905.22
Spinach 304.23 327.73 332.98 334.99 335.98
Lettuce 3,333.89 3,591.50 3,649.03 3,671.07 3,681.90
Cabbage 30,665.39 35,547.77 37,643.05 38,861.20 39,675.50
Root Vegetables Daikon 2,317.82 8,866.44 20,786.96 35,915.33 51,195.79
Carrot 62.25 238.12 558.26 964.56 1,374.94
Total Amount 363,021.92 448,183.26 525,396.23 584,514.59 637,677.26
Damage Ratio (%) 42.13 52.02 60.98 67.84 74.01
Classification Volcanic Ash Deposition (mm)
60 70 80 90 100
Rice Aquatic Rice 142,236.08 144,311.28 146,016.41 147,451.96 148,683.64
Upland Rice 1.61 1.63 1.65 1.67 1.68
Barley Hulled Barley 243.92 243.98 243.99 244.00 244.00
Naked Barley 50.98 50.99 51.00 51.00 51.00
Wheat 15.00 15.00 15.00 15.00 15.00
Minor Cereals Corn 29,173.02 29,175.00 29,175.61 29,175.82 29,175.91
Buckwheat 338.89 338.97 338.99 339.00 339.00
Others 2,522.20 2,522.75 2,522.91 2,522.97 2,522.99
Pulse Crops Soya 9,463.56 9,694.27 9,807.28 9,866.34 9,899.00
Adzuki Bean 119.82 122.74 124.17 124.92 125.33
Mung Bean 54.20 55.52 56.17 56.51 56.70
Others 577.21 591.28 598.17 601.78 603.77
Root And Tuber Crops Sweet Potato 4,745.33 5,531.26 6,125.98 6,561.15 6,873.38
Potato 109,980.59 128,195.87 141,979.52 152,065.20 159,301.72
Fruit Vegetables Watermelon 25.00 25.00 25.00 25.00 25.00
Oriental Melon 21.00 21.00 21.00 21.00 21.00
Cucumber 10,839.61 10,839.83 10,839.92 10,839.96 10,839.98
Squash 28,023.99 28,024.57 28,024.80 28,024.90 28,024.94
Leaf Vegetables Chinese Cabbage 233,327.35 235,946.29 238,028.58 239,732.17 241,157.21
Spinach 336.55 336.90 337.13 337.30 337.42
Lettuce 3,688.06 3,691.91 3,694.49 3,696.30 3,697.63
Cabbage 40,266.07 40,718.03 41,077.37 41,371.37 41,617.29
Root Vegetables Daikon 64,565.13 75,258.58 83,350.40 89,271.29 93,519.56
Carrot 1,733.99 2,021.18 2,238.49 2,397.51 2,511.60
Total Amount 682,349.16 717,733.83 744,694.03 764,794.12 779,644.75
Damage Ratio (%) 79.20 83.30 86.43 88.76 90.49

Fig. 4

Damage Ratio of Agricultural Crops in Gangwon Province Induced by Volcanic Ash Depositions