Post-Earthquake Reconnaissance of a Dam with Stabilizing Fill using Drone Photogrammetry
Article information
Abstract
Abstract
Post-earthquake reconnaissance is an important process for assessing the safety of massive structures. Dams are critical structures that require evaluation following an earthquake, as dam failure can lead to significant damage to the surrounding area. This paper presents drone (unmanned aerial vehicle) photogrammetry-based reconnaissance of the Angat Dam (Philippines), which has stabilizing fill, following the M 6.1 Luzon earthquake in April 2019. The author presents the results of visual inspection, drone digital mapping, and seismically induced deformation monitoring, as well as a general interpretation of dam safety. Analysis of the instrumentation data did not indicate that any significant changes in crest settlement, piezometric head, or seepage rate resulted from the earthquake. However, seismically induced longitudinal cracking along the dam crest was observed in the drone photogrammetry. The digital surface model, orthoimage, and as-built GIS geometry characterizations generated using the drone photogrammetry facilitated the geospatial analysis of seismic cracking and deformation. It is found that the uplift deformation was caused by counteracting effects between the existing dam body and its stabilizing fill. It is concluded that the results obtained using drone digital mapping are a valuable reference for future deformation monitoring using regular mapping methods in a 3D geospatial digital model.
Trans Abstract
요 지
지진 후 현장점검은 댐과 같은 구조물의 안전을 평가하는데에 중요한 과정이다. 댐은 특히 붕괴될 경우 주변 지역에 심각한 피해를 유발하기 떄문에 지진 후 안전성을 검토해야 할 매우 중대한 구조물이다. 이 논문은 2019년 4월 M6.1 루손 지진 이후 안정화 필로 보강된 필리핀 Angat 댐의 드론(UAV) 사진측량 기반 지진 후 점검에 대해 기술한다. 지진 후 점검 내용에는 육안조사, 드론 디지털 매핑, 지진으로 인한 변형 모니터링, 댐 안전성 분석 등을 포함한다. 댐 계측 데이터 분석에 따르면 지진으로 인한 댐 마루 침하, 간극수두 및 침투수량의 눈에 띄는 변화는 없었다. 그러나 드론 사진측량에 따르면 댐 마루를 따라 종방향으로 지진으로 인한 균열이 발생한 증거를 확인하였다. 드론 사진측량은 수치표면모형, 정사영상, 현장조건을 반영한 GIS 형상화로 지진 시 균열과 변형의 공간적 분포를 제시하였다. 본 연구는 지진으로 댐마루 융기 변형이 기존 댐체와 안정화 필존 사이 상호작용으로 유발되었음도 발견하였다. 드론 디지털 매핑 결과는 정기적인 매핑을 통해 향후 변형 모니터링을 위한 3차원 공간 디지털 모델에서 유용한 참고 자료가 될 수 있음이 입증되었다.
1. Introduction
The potential damage caused by earthquakes on structures, especially dams, can have disastrous consequences on the environment, property, and lives lost. Therefore, conducting post-earthquake reconnaissance on dams is crucial to evaluate their safety and identify potential issues.
Post-earthquake reconnaissance provides an opportunity to assess the safety of dams, identify potential problems, and determine their structural soundness to withstand future earthquakes. The reconnaissance can also improve earthquake prediction models by collecting data on the performance of dams during an earthquake, which will help researchers better understand the effects of earthquakes on dams and enhance their predictive models.
Although post-earthquake reconnaissance on dams is essential, there are only a few case histories available. One of the few cases is the 1964 Niigata earthquake in Japan, which caused significant damage to several dams in the region. Post-earthquake reconnaissance revealed that the cracks and deformations were caused by soil liquefaction beneath the dam foundations, leading to improved design and construction practices that are still used today (Idriss and Boulanger, 2008). Traditional post-earthquake safety inspections of dams were carried out using field visual inspection methods, which had limitations in grasping three-dimensional deformation information on large-scale dam facilities. Furthermore, many restricted areas were inaccessible for inspection by manpower, creating safety risks when working at heights.
Drone photogrammetry, the science of making measurements from photographs captured by unmanned aerial vehicles (UAVs), has become a popular technique for a wide range of applications, including surveying, mapping, and inspection.
For example, Honarmand and Shahriari (2021) used drone- based photogrammetry to map geological features and explore Cu mineralization. Ajayi et al. (2018) used UAV photogrammetry to model farmland topography and identify suitable sites for dam construction. Capolupo et al. (2015) used photogrammetry and hydrological models with drones to detect soil contaminated by copper for environmental monitoring purposes. Casella et al. (2020) investigated the accuracy of sand beach topography surveying by drones and photogrammetry. Cavalagli et al. (2020) studied the accuracy of UAV photogrammetric survey for evaluating historic masonry structural damages. Falorca et al. (2021) explored the use of drones for visual inspection of buildings and structures. Mohammadi et al. (2021) used UAVs and photogrammetry to generate a 3D model of a bridge for structural analysis. Habeenzu et al. (2020) proposed a method for automated UAV-assisted bridge inspections using photogrammetry and image processing techniques. Ko et al. (2021) presented ABECIS, an automated building exterior crack inspection system that uses UAVs, open-source deep learning, and photogrammetry.
In general, drones are suited for mapping massive water infrastructures such as dams and levees. Drone surveying (i.e., photogrammetry) can complete the mapping faster, cheaper and safer. Drones can help engineers to map large areas in a quick, cost-effective manner and to provide high- resolution data that helps expedite workflows in a variety of configurations. Drone operators primarily use cameras to visually inspect the equipment, but photogrammetry can also assist in the inspection.
With the support of control points like known coordinates or placed markers, the drone is able to fly autonomously using a calculated flight path at a given altitude. Depending on the equipment, the drone can take common high-resolution colored and infrared pictures. According to a published paper, it is recommended that each captured picture overlaps the previous image 80 percent to the front and 60 percent to the side (https://ecourbanhub.com).
A further benefit of drones is that they can be used for volume measurements. After mapping the site with a drone, it is possible to generate a digital surface model (DSM). Ground-based surveying, particularly for a dam, would be more dangerous and time-consuming.
Drone-based photogrammetry also has emerged as an effective method for conducting dam inspections. For example, Angeli et al. (2019) generated a dense 3D model of a dam surface using UAVs for visual inspection. Buffi et al. (2017) surveyed the Ridracoli Dam using both UAV-based photogrammetry and traditional topographic techniques to inspect vertical structures. Congress et al. (2022) shared lessons learned about monitoring dam infrastructure assets using UAVs. Henriques and Roque (2015) examined the use of UAVs as a support to visual inspections of concrete dams. Huang et al. (2023) developed a dam surface deformation monitoring method based on a concentric circle center location algorithm. Khaloo et al. (2018) utilized UAVs and 3D computer vision for visual inspection of a large gravity dam. Laasch et al. (2022) discussed automated inspection within galleries of large dams.
Overall, the reviewed studies demonstrated that drone photogrammetry is a promising and effective method for dam inspection, providing accurate and detailed information on dam condition and facilitating early detection of potential safety issues.
However, to the best of the author’s knowledge, there has been limited research on post-earthquake dam characterization through the use of drone photogrammetry. Following an earthquake, dams are typically inspected visually and surveyed using conventional methods. However, this process can be time-consuming and may not provide a complete understanding of the dam’s behavior during seismic events. This is because access to many areas of the dam and its structures is limited, and the safety of personnel involved in the investigation cannot always be guaranteed.
This study presents an investigation of the post-earthquake assessment of Angat Dam in the Philippines using drone photogrammetry. The analysis involves the interpretation of drone-generated 3D reality models to identiy seismically induced dam deformation characteristics and to develop recommendations for potential countermeasures against further damage caused by the earthquake. The overall in-situ stability and deformation of the dam following the M 6.1 Luzon earthquake on April 22, 2019, are evaluated using various methods including visual inspection (comprising field survey), drone digital mapping, and instrumental data analysis. Through the combined analysis of these approaches, the safety and stability of the dam are determined.
2. Dam and Earthquake
Angat Dam is located in an area of very high seismicity. The West Valley Fault segment passing within 250 m of the left abutment of the main dyke is 90 km long and capable of producing a magnitude Mw 7.2 earthquake, which the main dam and main dyke must be able to withstand safely.
2.1 Dam Rehabilitation History
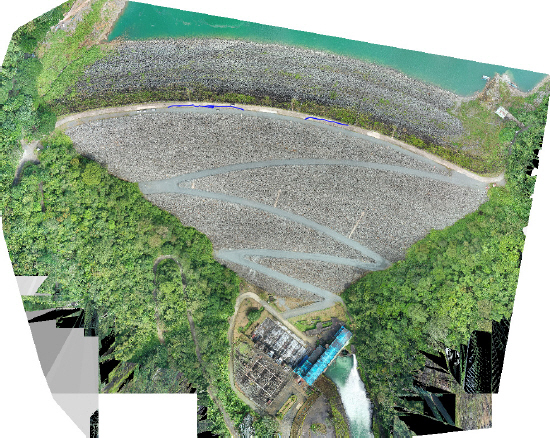
The original construction of Angat Dam was completed in 1969 for water supply and hydropower generation to the Metro Manila and other areas (Park and Kim, 2017). The main dam height was 131 m. The reservoir capacity of the dam was about 850 million m3. The main roles of the dam are to power a hydropower plant, to provide irrigation, and to provide a water supply. The type of dam is an inclined-core rockfill dam. The dam is of utmost importance for the densely populated Metro Manila area (60 km away) in the Philippines, as it serves as virtually the only water supply reservoir. The orthoimage and location map of Angat Dam and reservoir is shown in Fig. 1.

Angat Dam and Reservoir (by Google Map)
Because of aging and seismic issues (Park, 2014), the rehabilitation project was initiated. The project was completed in 2018, which included the placement of stabilizing fill on the downstream slopes (Yooshin, 2016; Fig. 2).

Detailed Image of the Stabilizing Fill on the Downstream Slope
2.2 Earthquake
On April 22, 2019, an earthquake with a magnitude of 6.1 occurred in the vicinity of Luzon Island, approximately 88 km away from Angat Dam (Table 1). The Philippine Institute of Volcanology and Seismology announced the earthquake of magnitude 6.1 with epicenter 18 kilometers N 58E of Castillejos. A maximum Mercalli intensity scale value of 6.6 was observed in Gutad, Floridablanca, Pampanga according to the United States Geological Survey shake map for the 2019 Luzon earthquake. The intensity around Angat dam area was found to be IV to V.

2019 April 22 Luzon Earthquake
As a result of the seismic activity, visible cracks and local deformation were observed on the cement paved slabs of the main dam crest. Of greater concern was the fact that these cracks and deformations had been gradually developing since the earthquake. After considering various inspection methods, Angat Hydropower Company and stakeholders decided to conduct a post-earthquake reconnaissance and dam safety inspection. In response to this decision, K-water conducted field inspections, which included visual inspection, drone digital mapping, and an electrical resistivity survey.
3. Post-Earthquake Reconnaissance
3.1 Visual Inspection
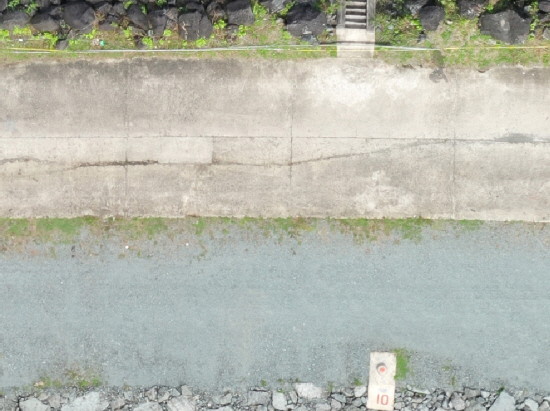
In general, the Angat Dam embankment was found to be in a satisfactory condition, with no visible signs of seepage or downstream/upstream slides. However, the dam crest was observed to have longitudinal cracks, as shown in Fig. 3. Additionally, a portion of the pavement downstream had slightly lifted, which may have been caused by the newly-built stabilizing fill in the downstream area adding force that pushed a relatively-loose area of the existing dam body due to the earthquake.
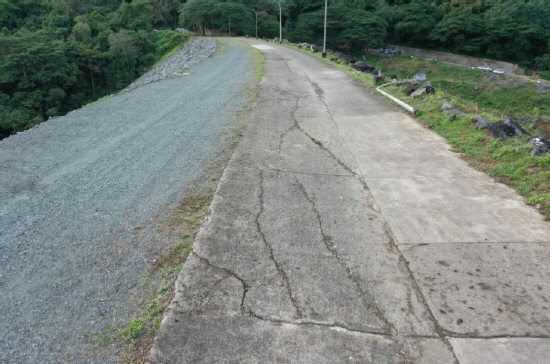
Seismically Induced Cracking on Dam Crest
It should be noted that the visual inspection alone was unable to provide any quantified geospatial evidence of dam deformation, such as settlement, uplift, and displacement of the dam.
3.2 Sensing Data Analysis
The Angat Dam is classified as an inclined cored rock-fill type dam and features a newly constructed downstream stabilizing fill. Various standard instrumentation measuring devices are installed to monitor dam safety, including displacement survey monuments, open standpipe piezometers, a seepage weir, and accelerometers for measuring strong motion.
The accelerogram data from the strong motion measuring accelerometers is particularly valuable for understanding the seismic shaking experienced by the dam. The accelerogram data recorded a peak acceleration of 0.027 g for the main dam foundation and 0.085 g for the main dam crest (Fig. 4).

Retrieved Acceleration Time History for Angat Main Dam in the Dam Axis Direction
The survey monument data gathered by the local dam office did not reveal any clear indication of earthquake-induced settlement at the monument points.
Piezometers are used to measure the groundwater level or pressure head, and no significant changes were observed in the piezometric head due to the seismic event on April 22, 2019.
Seepage flow rate measurement is crucial for monitoring the safety of cored embankment dams. Fig. 5 illustrates the seepage rate measurement time history with the reservoir water level and rainfall data. The seepage rate of Angat Dam was mainly affected by the reservoir water level during the dry season and rainfall during the rainy season, and there were no noticeable changes in the seepage rate due to the earthquake.
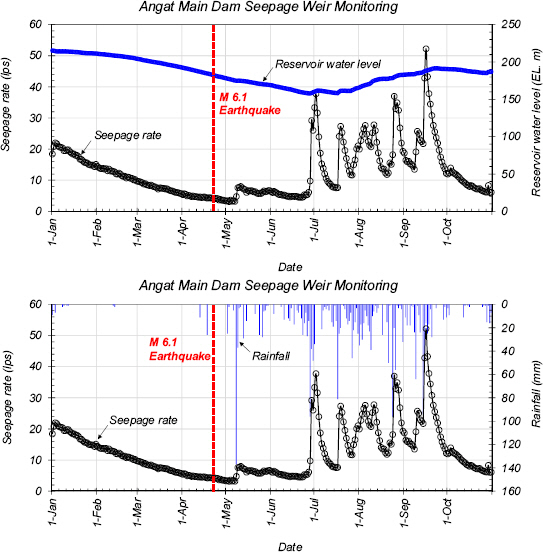
Seepage Rate Time History of Angat Main Dam
Based on instrumentation data analyses for Angat main dam, there were no noticeable changes of the crest settlement, piezometric head, and seepage rate due to the M 6.1 earthquake on April 22, 2019. These findings provide reliable information regarding the seismic safety of the dam.
3.3 Discussion on Seismic Deformation
The safety of existing fill dams in areas of high seismicity is of utmost importance based on recent case histories showing multi-hazard patterns such as excessive deformation, internal erosion, landslides, rock falls, and damage to appurtenant structures (Wieland, 2012; Park and Kishida, 2019). Most aging fill dams lack sufficient information, such as the seismic deformation characteristics, the dynamic material properties and construction history, when they are subjected to a seismic evaluation.
Therefore, it is a very meaningful task to examine the empirical behavior of dams that have actually experienced earthquakes and to consider the expected deformation. However, data on the amount of deformation of dams during actual earthquakes are insufficient, except for Swaisgood (2014). Since the Angat Dam is virtually the only source of water supply in Metro Manila, comparing and analyzing the empirical seismic deformation is a valuable discovery for current and future research.
Swaisgood (2014) collected extensive data about crest settlement from many case histories. In this paper, a term, NCS (normalized crest settlement) is defined as the amount of settlement of the crest of the dam expressed as a percentage of the height of the dam (DH) plus the thickness of the alluvium (AT). Eq. (1) below can be particularly useful for predicting the empirical margin of the freeboard after earthquake-induced crest settlement. Overall, a well-compacted fill dam with modern construction technologies shows very good performance under strong shaking.
Based on the chart, it is found that the serious levels of damage (which means 1% of normalized crest settlement) is reported in instances where the PGA exceeded 0.30 g. Minor to no damages was empirically reported where the PGA was equal to or less than 0.20 g.
We can compare Angat Dam case with the Swaisgood chart in 2014. The April 22, 2019 earthquake magnitude was 6.1. The recorded PGA in the dam foundation was 0.027 g. The dam height is 131 m. assuming there is no alluvium foundation, NCS in % can be computed as,
The expected empirical crest settlement is about 2 cm only.
Swaisgood (2014) empirically suggested the degree of damage as related to crest settlement (Table 2). According to this table, the expected degree of damage for Angat Dam is none.

Degree of Damage as Related to Crest Settlement (Swaisgood, 2014)
3.4 Drone Digital Mapping
To assess the post-earthquake site characteristics of Angat Dam, drone digital mapping technology utilizing photogrammetry processing was employed. The drone utilized for mapping was DJI’s Mavic 2 Pro, and Pix4D’s Pix4Dcapture (version 4.6) was partially used for a double grid mission for mission planning and practice. The double grid drone mission flight was performed at an altitude of 65 m from the take-off position, an overlap of 80%, and a camera pitch angle of 70 degrees. Manual manipulation with careful mission planning in advance was used for reality modeling of upstream and downstream areas.
Bentley Systems’ ContextCapture (version 10.15.0) was utilized among various drone mapping software for 3D modeling of Angat Dam. These software allowed for the creation of high-resolution 3D models, as well as the generation of digital surface models (DSM) and true orthophotos.
Accurate data acquisition is critical to achieve high-quality modeling. For the drone mapping of Angat Dam, step-by-step photo images were obtained by drone mission flights. The mapping camera utilized in this study was a Hasselblad L1D-20c model, equipped with a CMOS (Complementary Metal-Oxide-Semiconductor; active-pixel image) sensor of 1 inch and an effective pixel count of 20 million. The camera lens possessed a field of view of 77 degrees. The lens aperture range spanned from f/2.8 to f/11, while still images were acquired at a size of 5,472 × 3,648 pixels, and stored in JPEG format. The total number of photos taken was 1,728, and the ground coverage was 393,948 m2.
To ensure the accuracy of drone mapping points, ground control points (GCP) were utilized. Survey monuments installed on the dam were already discernable from the drone flight, and the monument coordinates were used as GCP. The survey monument points on top of the monument plates were primarily used as ground control points. To ensure visibility and potential utilization later, the index numbers were permanently painted, as shown in Fig. 6. The arrangement of ground control points for drone mapping of Angat dam is shown in Fig. 7.
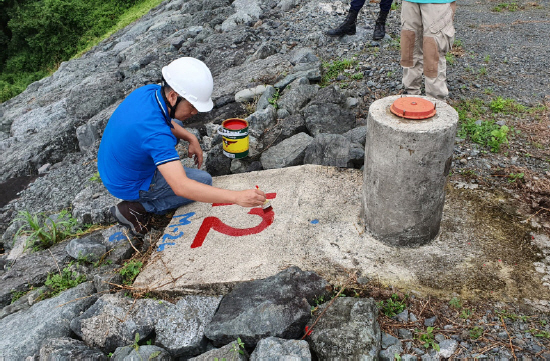
Example of a Survey Monument Used for GCP and Numbering of GCP

Ground Control Points Used for Drone Photogrammetry
For post-processing, the local coordinate system adopted for post-processing was the Luzon 1911 / Philippines zone III, or EPSG: 25393.
For the post-processing, the initial calibration values and the optimized results for the drone camera are listed in Table 3.

Camera Calibration Results
The following map shows the aerial photo distribution for Angat Dam (Fig. 8). It also shows position uncertainties: Top view (XY plane), side view (ZY plane) and front view (XZ plane) of computed photo positions.
Position Uncertainties: Top View (XY Plane), Side View (ZY Plane) and Front View (XZ Plane) of Computed Photo Positions
The process of photo matching involves automatically generated tie points that connect all photos and uses different quality measures to verify the accuracy of the matching and identify potential issues. Reprojection error measures the pixel reprojection error for each tie point and graphically represents the values in a top, side, and front view of the scene. For this study, 32 control points and 3 user tie points were used. For each control point, estimated position error was reasonable good. Global root mean square of reprojection error of control points was mostly less than 3.0. The median 3D error of control points was 4.4 cm.
Through the post-processing using ContextCapture, we produced DSM (digital surface model), orthoimage, and the 3D model. For the analysis of cross-sectional geometry prifiling, QGIS was used. The calibrated dataset was 1,664 of 1,728 photos (96%) and a median of 48,127 keypoints per image was extracted. A total of 452,616 tie points was collected with a median of 1,368 points per photo. Reprojection error (RMS) was 0.64 pixels. The average ground sampling distance (GSD) was 2.13 cm/pixel.
The optimized focal length of the camera was 10.53 mm, which was equivalent to 28.71 mm for a 35 mm full-frame body camera.
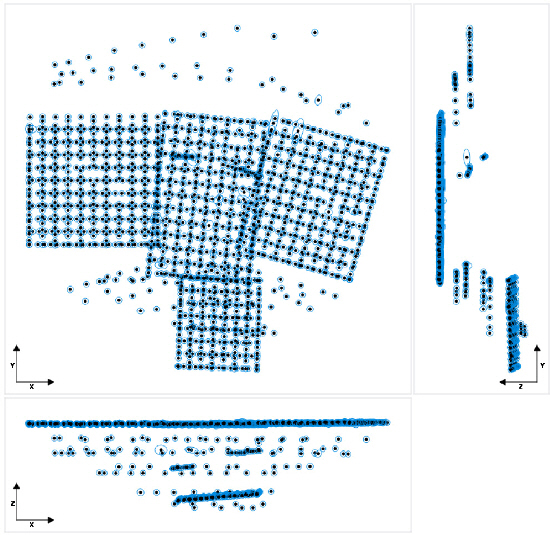
The minimum number of photos per tie point was 2 and the maximum was 102. The average number of photos observing a tie point was 5. Fig. 9 below shows the top view (XY plane), side view (ZY plane) and front view (XZ plane) displays of all tie points, with colors representing resolution in the individual point position.
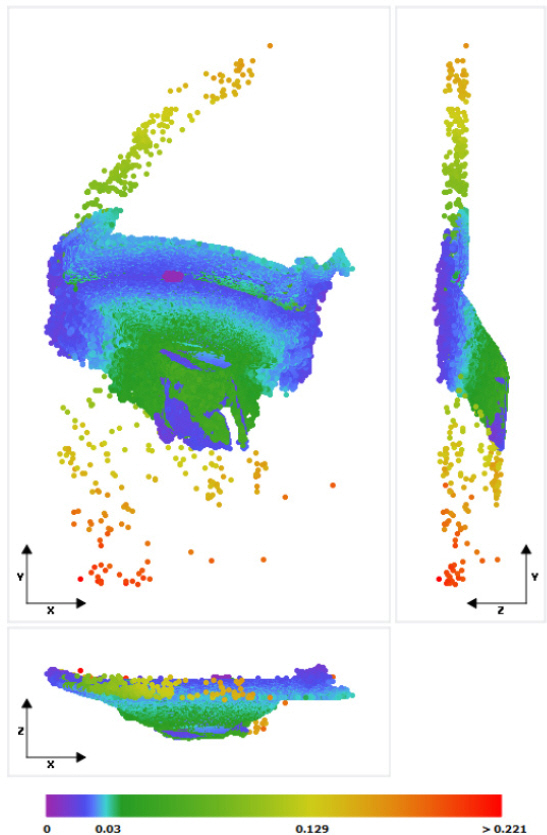
Resolution Displays of All Tie Points, With Colors Representing Resolution in the Individual Point Position. The Values are in Meters/Pixel
4. Results of Photogrammetry
The photogrammetry processing of drone images produced several useful outputs for Angat Dam, including a DSM, orthoimage, as-built 3D model with mesh, spatial distribution of seismically induced cracking, and cross-sectional geometry.
Fig. 10 displays the orthoimage of Angat Dam, indicating two groups of blue lines representing earthquake-induced cracking on the dam crest. Fig. 11 provides more detail on the cracks, which were developed mainly in a longitudinal direction along the dam axis. The cracks were divided into two groups, Crack A on the left side close to the right abutment and Crack B on the right side close to the left abutment. According to the photogrammetry result, the total length of Crack A is approximately 88.1 m, and Crack B is approximately 55.2 m, with a maximum width of about 8 mm. The crack width was measured by visual inspection with a precise ruler. Fig. 12 shows a partial orthoimage of Crack A, which has high resolution and good quality photogrammetry that distinguishes cracking. The QGIS program was used to draw lines of cracking on the orthomosaic base accurately.
Orthoimage of Angat Dam Produced by Drone Digital Mapping

Lengths of Major Cracks of Angat Dam
Orthoimage of the Cracks in the Crest
Fig. 13 displays a DSM model of Angat Dam that includes elevation contours. In addition to the dam crest, the ramp road used for maintenance on the downstream slope and the power station are clearly identified. The resulting model displays a high level of accuracy in terms of geometry. It is important to mention that the water in the impounding reservoir cannot be captured with precision using photogrammetry techniques as of yet. Nonetheless, the model of the dam structure itself is highly realistic and of excellent quality.

DSM (Digital Surface Model) with Elevation Contour for Angat Dam
The elevation profile along the dam crest axis at the middle of the dam is presented in Fig. 14. The top elevation of the crest was found to be EL. 222.85 m, while the lowest crest elevation was found to be 222.01 m near the left abutment. The maximum elevation difference of 84 cm was observed on the dam crest surface. The center part of the dam crest was relatively higher than the part near the dam abutment. The regions of Cracking A and B were relatively higher than other regions on the dam crest. This could be attributed to the counteracting effect of seismic shaking and stress condition of stabilizing fill. A newly constructed stabilizing fill exerts a pushing loading on the existing dam body towards the upstream reservoir. Additionally, the (partial) impounding reservoir water works as a pushing pressure on the existing dam body towards the downstream direction. Seismic acceleration can shake the whole dam body back and forth and up and down, and the near crest part of the dam is shaken more due to the amplification of seismic motion through the dam body. The combined effect of static and dynamic loading might cause cracking (Zone A and B) and the uplift of the concrete slab in the middle of the dam axis.
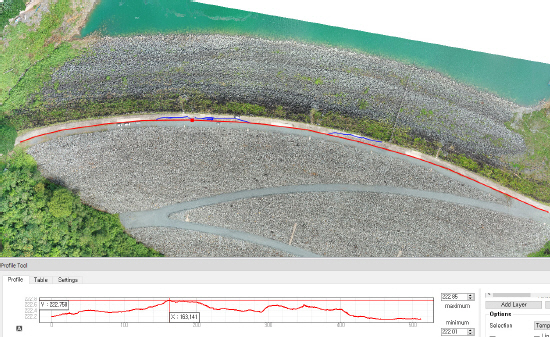
Longitudinal Elevation Profile of the Dam Crest (EL. at the Top, Center = 222.85 m)
Fig. 15 shows another aspect of the elevation profile along the dam crest with color contrast. As seen in this Figure, Crack A is observed to be higher than the other crest region. Crack B is less apparent but also shows a slightly higher elevation.
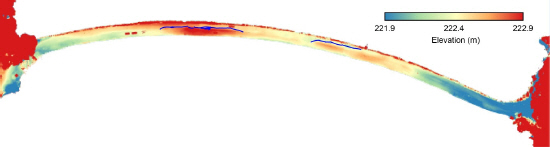
Elevation Difference Profile with Color Contrast for Angat Dam Crest
Figs. 16 to 17 depict the cross-sectional geometry of Angat Dam obtained through drone mapping and GIS analysis. The objective of this analysis was to assess the as-built geometry and determine if seismic shaking had any impact on the overall slope angle. Drone mapping was a valuable tool for interpreting the as-built geometry since it precisely captures reality.
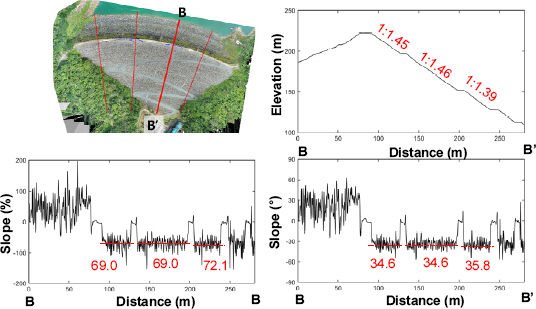
As-built Cross-section and Slopes Obtained from Drone Photogrammetry for Angat Dam (Section B-B’)
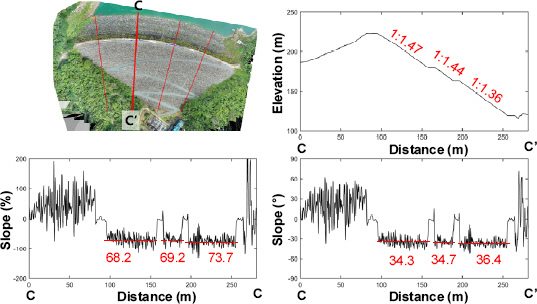
As-built Cross-section and Slopes Obtained from Drone Photogrammetry for Angat Dam (Section C-C’)
The study characterized four cross-sectional geometries (B-B’ and C-C’). For each figure, an index map, the actual cross-sectional geometry of the dam, and varying slope angle in % and degrees are subsequently presented.
The downstream slopes range from 1:1.36 to 1:1.47, with most being greater than 1:1.4. According to the completion drawing, the downstream slope is 1:1.4 (= 35.5° = 79%). The average as-built slopes are typically slightly less steeper than 1:1.4 except for the relatively steeper lower slope near the dam toe. Most of the downstream slope angles range from 34° to 36°, which is similar to the drawing (35.5°). In this context, the slope is expressed as the ratio of the unit rise to the run. The slope can also be represented in degrees and percentage units, which are calculated by dividing the rise by the run in degrees and percentage, respectively.
There is no evidence of seismic shaking that induced the loosening or deformation on the upper part (or near crest) of the dam body, as there was no previous record before the earthquake. Instead, the dam appears to show no slope sliding or noticeable slope deformation.
The drone mapping results can serve as a valuable reference record for future deformation monitoring.
In order to quantitatively analyze the elevation of the dam crest with and without cracking areas, more detailed cross-sectional geometry was obtained from the 3D reality model, as shown in Figs. 18 to 22. Fig. 18 depicts the areas without seismic cracking zones. From the GIS (Geographic Information System) elevation profile, it was observed that the midpoint at the interface line between the existing concrete paved surface and the newly constructed unpaved surface is lower than the upstream edge of the crest. On the other hand, Fig. 19 illustrates that the elevation of the interface point is significantly higher than the cracking point, with a difference of approximately 38 mm. Consequently, the inner part of the cracking concrete pavement has been lifted up by a few centimeters.
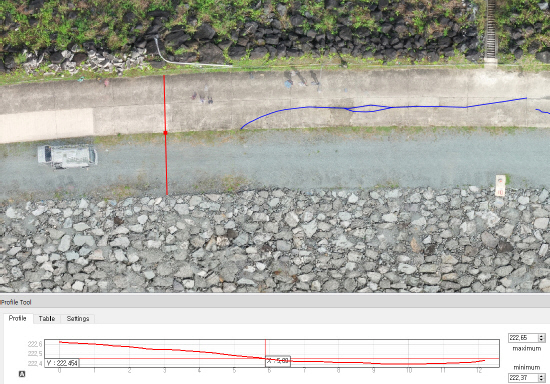
Cross-section Profile of the Dam Crest (EL. at Midpoint = 222.454 m)
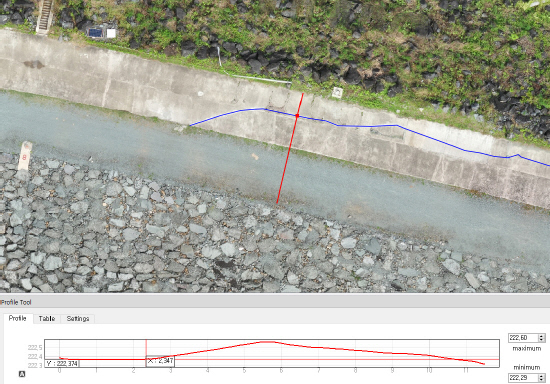
Cross-section Profile of the Dam Crest (EL. at Cracking Point = 222.374 m, EL. at the Top = 222.566 m)
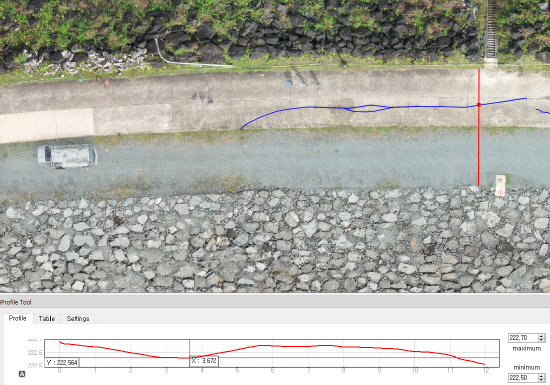
Cross-section Profile of the Dam Crest (EL. at Cracking Point = 222.615 m, EL. at the Top = 222.653 m)
As shown in Fig. 20, the trend is similar to that of Fig. 19. The difference in elevation between the cracking point (i.e., the lowest level) and interface point (i.e., the highest level) is more significant at 24.2 cm. It is noteworthy that the upstream concrete pavement before the cracking occurred had an even surface.
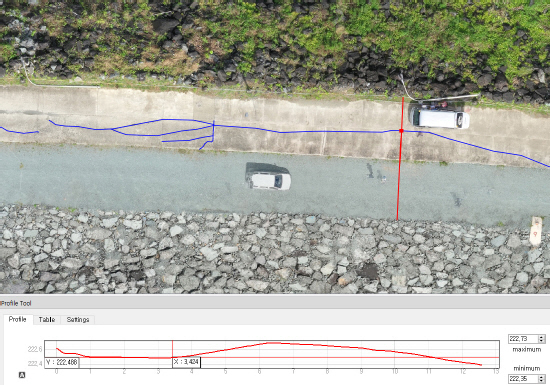
Cross-section Profile of the Dam Crest (EL. at Cracking Point = 222.488 m, EL. at the Top = 222.73 m)
Fig. 21 illustrates the elevation profile without any observed cracking. It can be seen that the paved concrete surface did not experience any uplift. Instead, the newly constructed unpaved surface appears to be relatively higher.
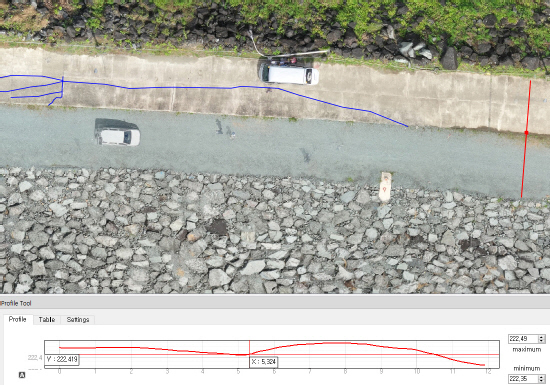
Cross-section Profile of the Dam Crest (EL. at Midpoint = 222.419 m)
Fig. 22 exhibits the lifting deformation of the concrete pavement surface within the Crack B area. It is noteworthy that the elevation difference between the cracking point and interface point is 19.2 cm, indicating a considerable uplift.
In summary, this study utilized drone digital mapping to investigate seismically induced cracking on the Angat main dam. The cracking was mainly found in a longitudinal direction along the dam crest, with two distinct groups of cracking observed. The concrete pavement within the cracking showed uplifting deformation, with elevation differences between cracking and interface points ranging up to 24 cm. Cross- sectional geometry analysis revealed downstream slopes varying between 1:1.36~1:1.51, mostly slightly greater than 1:1.4 as specified in the drawing of completion.
Although no clear evidence of slope sliding or deformation was found overall, local areas exhibited uplifting deformations, warranting further inspections to investigate potential voids or issues with the core zone. The drone digital mapping results will serve as a valuable reference for future deformation monitoring if necessary.
5. Conclusion
The Angat Dam, constructed in 1967 in a high seismicity area, underwent a rehabilitation project in 2018 due to aging and seismic issues. This project involved stabilizing fill placement on the downstream slopes and installation of new monitoring instruments.
This paper presented the activity of post-earthquake reconnaissance of Angat Dam mainly based on drone photogrammetry. Some useful findings are as follows.
According to the analysis of instrumentation data for the Angat main dam, no significant changes in the crest settlement, piezometric head, and seepage rate were observed during the M 6.1 earthquake on April 22, 2019.
The strong motion data indicated that the PGA in the dam foundation was only 0.027 g, which is considered relatively low and insufficient to cause significant deformation or changes in seepage rate. The maximum acceleration at the dam crest was 0.085 g, and the amplification factor was 3.1, which falls within a reasonable range based on empirical observations.
The utilization of drone photogrammetry enabled the generation of a digital surface model (DSM), orthoimage, 3D model, and as-built GIS geometry characterizations. The resulting 3D digital model provided an accurate representation of the geospatial features of seismic cracking and deformation, which was not captured by the instrumentation data.
The use of drone digital mapping at Angat main dam revealed that the earthquake-induced cracking occurred predominantly in a longitudinal direction along the crest of the dam. The cracking areas were identified as two distinct groups. Notably, the uplift deformation of the concrete pavement surface within the cracks was significant due to counteracting effect between existing dam body and newly constructed stabilizing fill. The elevation difference between the cracking point and the interface point, which refers to the interface between the existing concrete pavement and the newly built unpaved surface, ranged up to 24 cm.
From the analysis of the as-built cross-sectional geometry of the Angat main dam, it was observed that the downstream slopes vary within the range of 1:1.36~1:1.51, with most of them being slightly greater than 1:1.4 as originally specified. However, there was no distinct indication of slope sliding or deformation.
The study highlights the potential of drone photogrammetry as a reliable and efficient tool for various applications related to dam monitoring, mapping, and assessment after earthquakes. The results show that drone photogrammetry offers a cost- effective and efficient solution for monitoring areas that are difficult to access or considered hazardous, making it a promising technique for numerous applications. The findings of this study could have significant implications for the civil engineering industry, paving the way for future research and development of drone-based monitoring and mapping techniques.
It is recommended that the effectiveness of the stabilization measures taken should be monitored regularly. The instrumentation data should be analyzed regularly to detect any changes in crest settlement, piezometric head, and seepage rate. If required, irregular dam crest pavement should be replaced to prevent further deformation.
Regular monitoring of the seismic cracking in the dam is necessary to assess any progression. It is necessary to regularly perform drone photogrammetry, which enables 3-dimensional quantitative and spatial analysis of dam deformation over time.
It should be noted that this paper is a site-specific observation and result. More empirical data about seismic deformation of dams are necessary. In the future, additional studies on the interaction between the existing aged dam body and the newly reinforced stabilizing fill during seismic shaking are needed. In addition, although there was no remarkable seismic deformation, the effect of crest cracks on the safety of dams needs to be studied.
Acknowledgment
The author would like to express their sincere gratitude to AHC (Angat Hydro Company) for their support and cooperation in preparing this article. This study is sponsored by the Institute of Information & communications Technology Planning & Evaluation (IITP), “Development of multi- dimensional visualization digital twin framework technology for the display of ultra-precise visible and invisible information of 0.5 mm or less.” Research Project, April 2021 - December 2024, Ministry of Science and Technology Information and Communication.